Chapter 4 Results
4.1 Museum in US
4.1.1 Discipline Museums Distribution in States
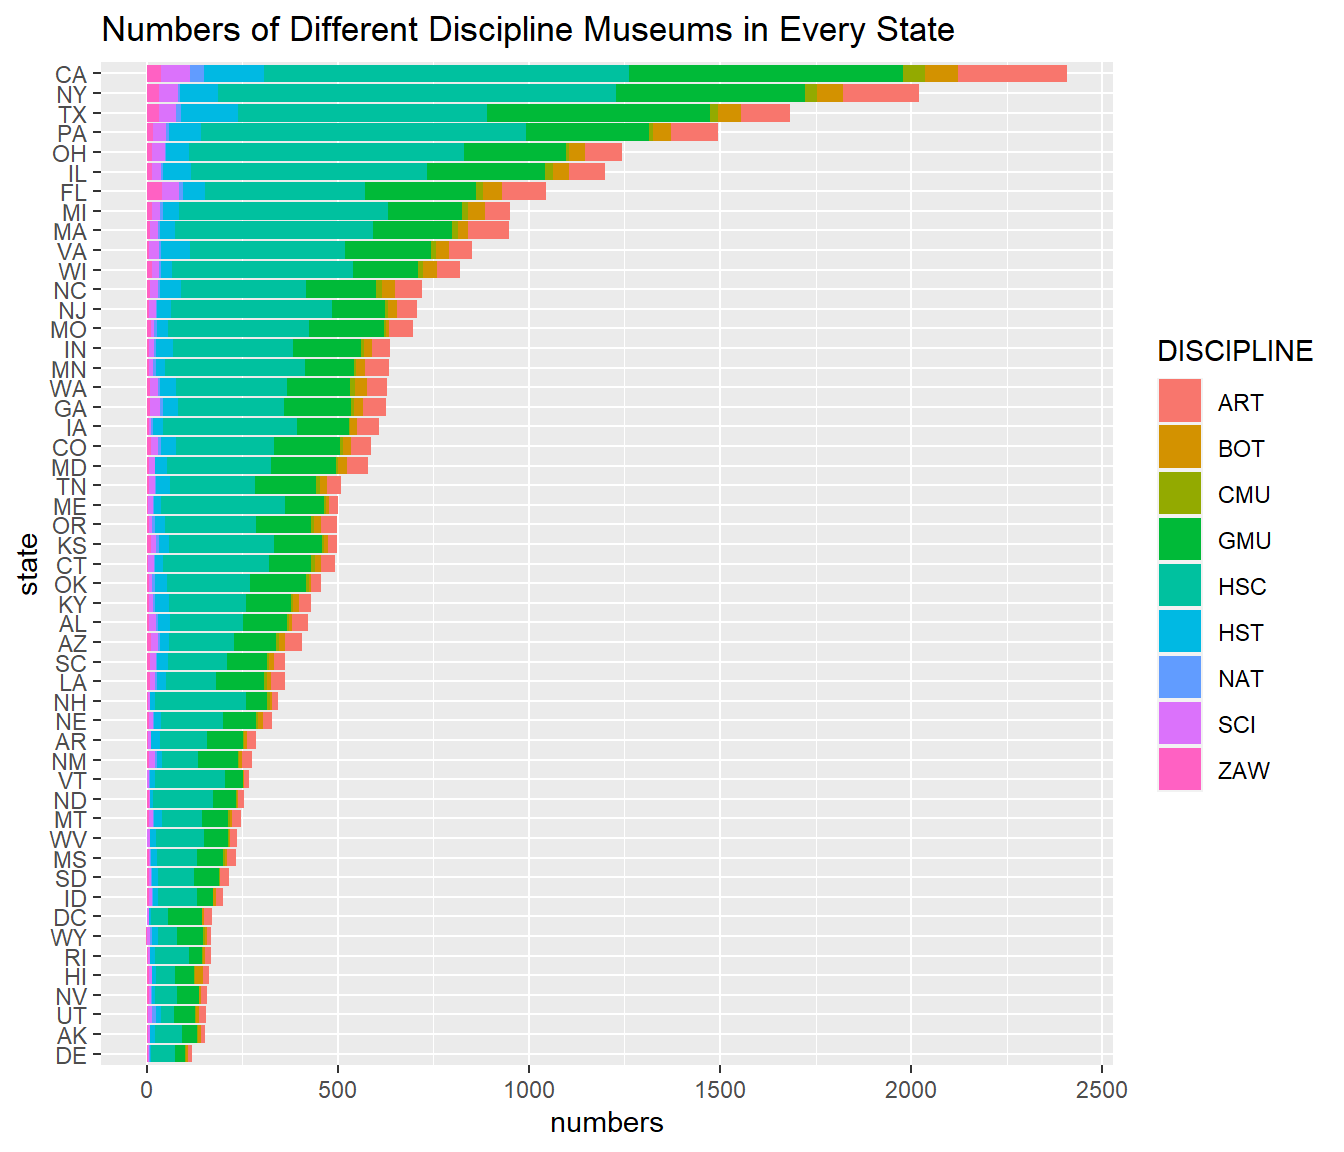
We can find that HSC(Historical Societies and Historic Preservation) and GMU(Uncategorized or General Museums) take great share in each state’s museums, especially HSC. And the proportions of different disciplines in different states remains similar, which means there is no obvious tendency of a state to own one kind of museum more than other kinds.
4.1.2 Relationship Between Income and Discipline
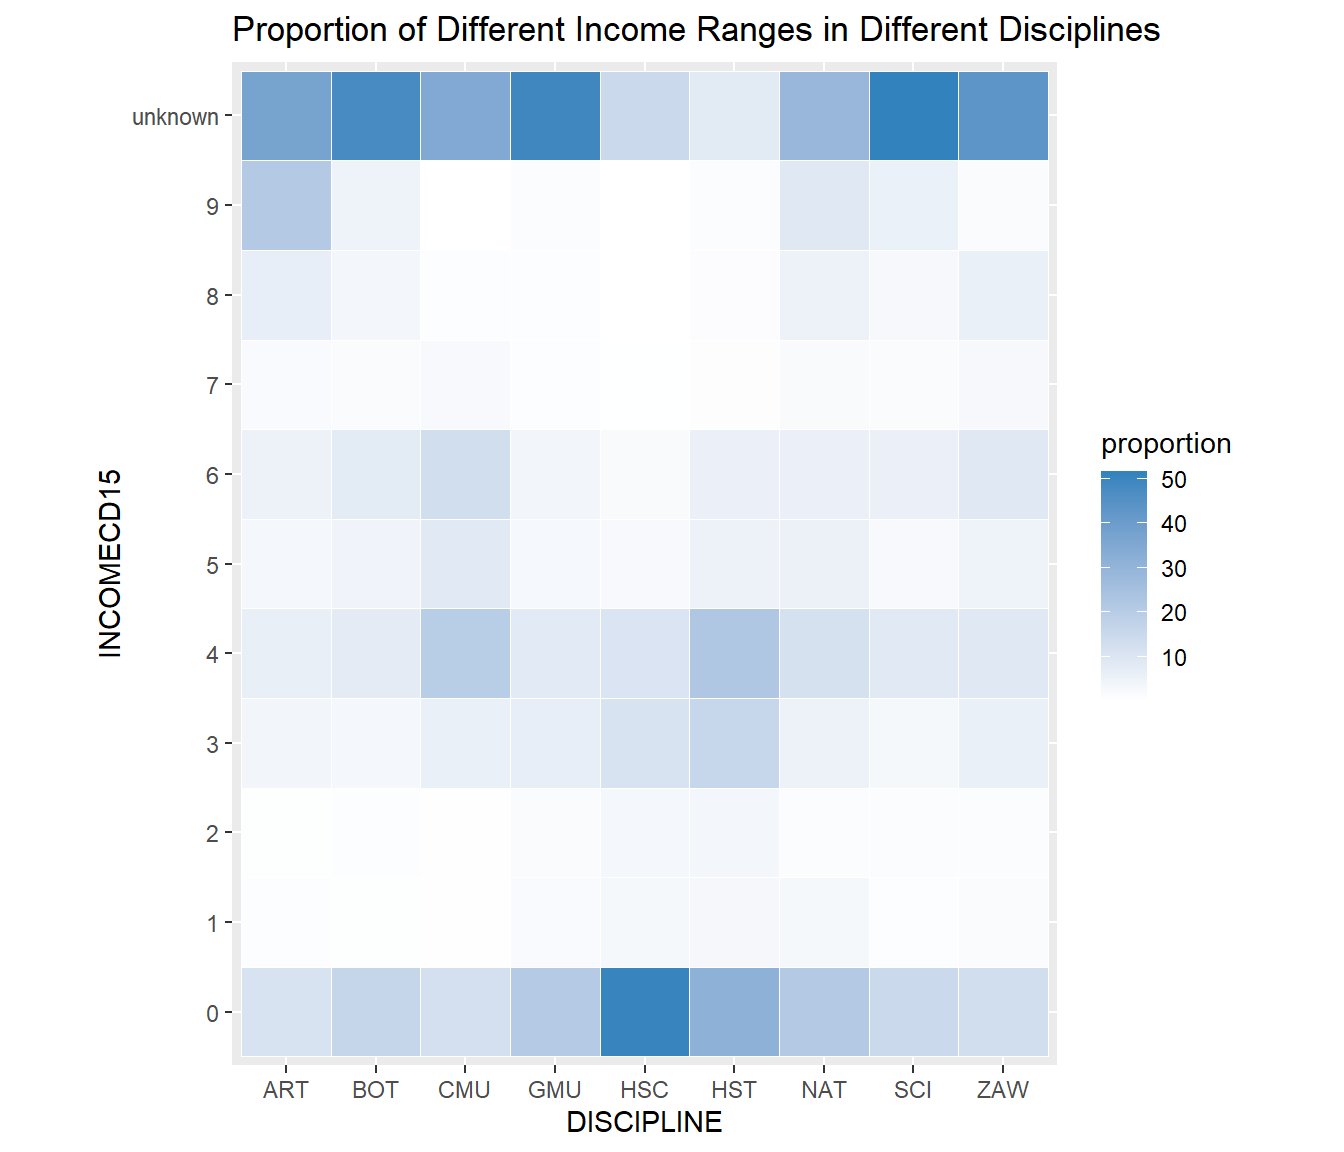
The 0~9 of incomecd15 present different income ranges: 0, $1 to $9,999, $10,000 to $24,999, $25,000 to $99,999, $100,000 to $499,999, $500,000 to $999,999, $1,000,000 to $4,999,999, $5,000,000 to $9,999,999, $10,000,000 to $49,999,999, $50,000,000 to greater.
It shows that there are a lot of museums did not provide their income status. In those museums that provided incomes, except ART and CMU, other discipline museums that did not have incomes take biggest share, especially HSC, since most of this kind of museum don’t need tickets.
But since Art Museums are often charge highly, there are great proportion of Art museums earn income over 50,000,000 in 2015. And there are more CMU (children museum) earn between 25,000 and 4,999,999 than other incomes, which means most CMU need tickets and parents are willing to visit them to educate their kids.
And for other kinds of museums, incomes between 25,000 and 4,999,999 also take some shares.
4.1.3 Relationship Between Location and Revenue
The sustainable development of museums can preserve local culture and history. However, it’s possible to face the situation that museums with certain themes are more popular than others, hence the considerable income for local governments. It’s essential to keep the balanced development for all categories instead of being profit-seeking. If the current development of the museum follows the local features, then the geographical location should be a dominant variable in terms of the distribution of the museum.
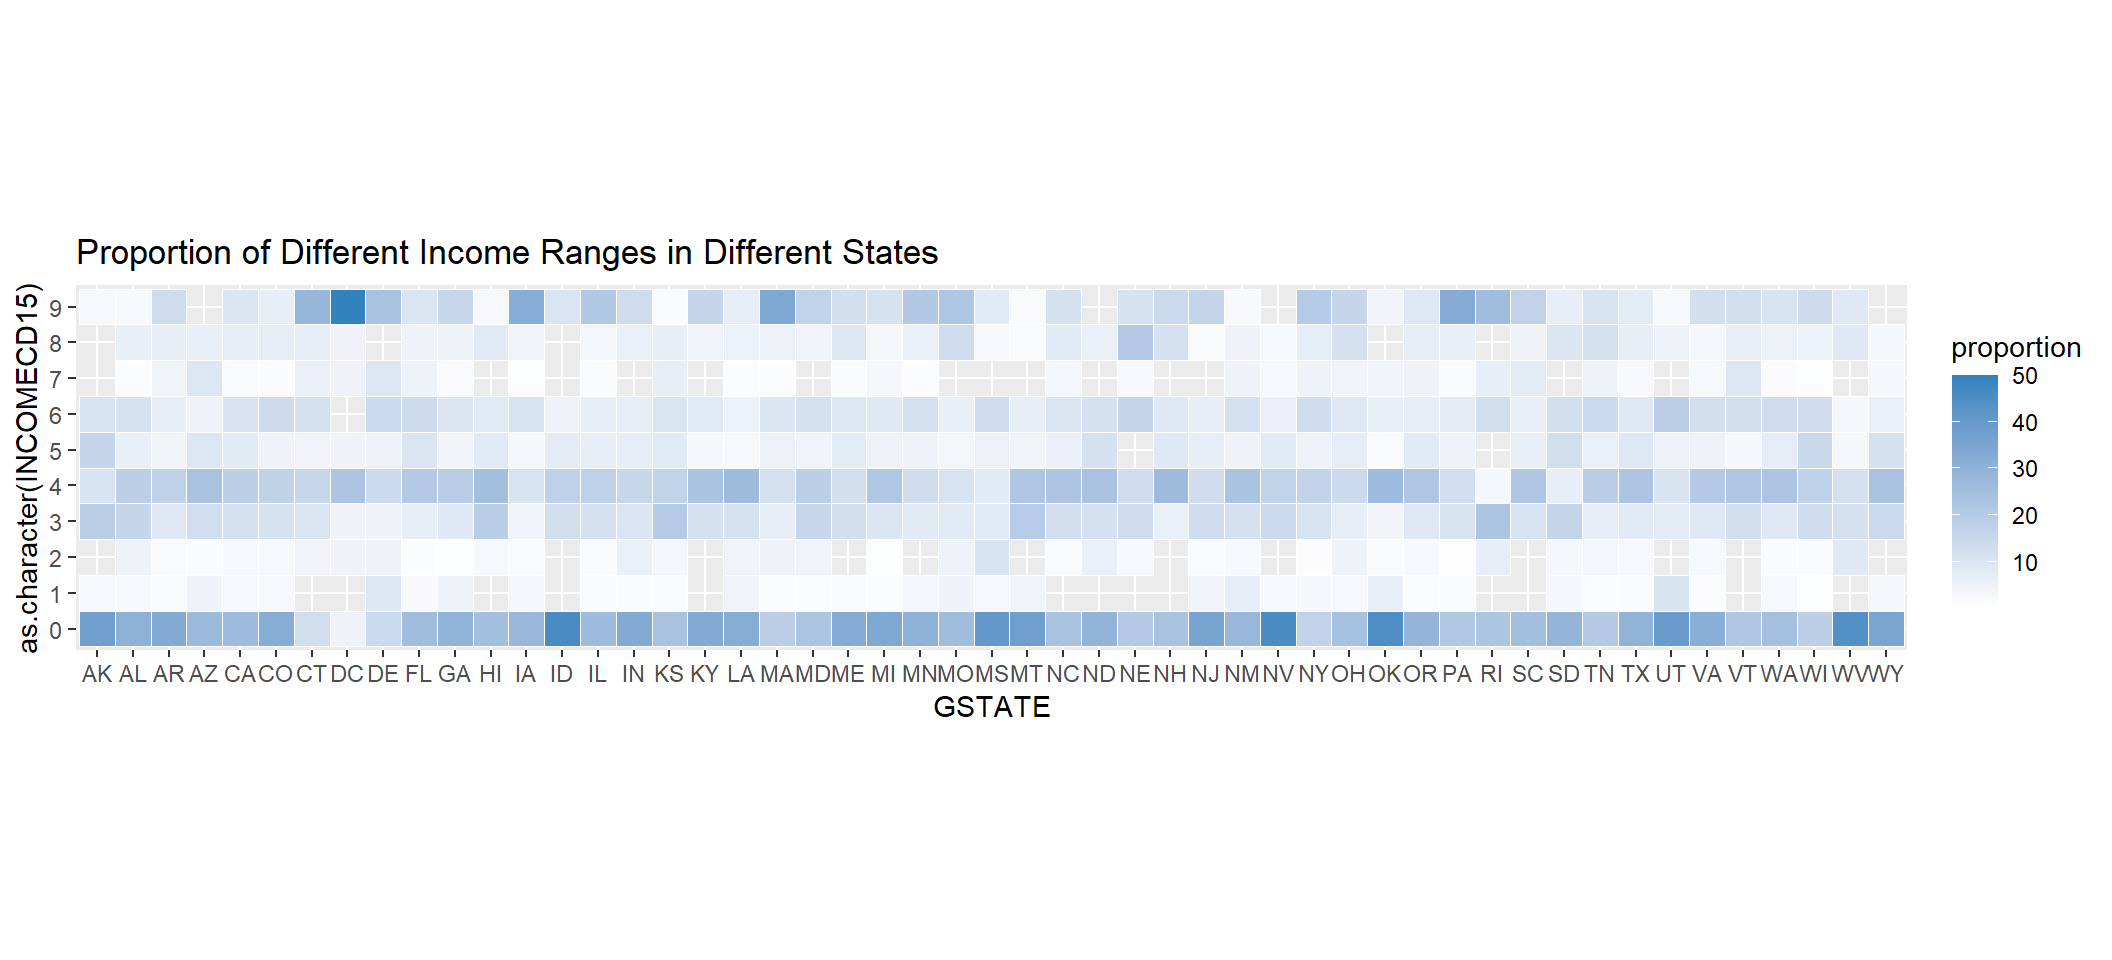
First, we can look at the distribution of museum income levels among different states. We can see that there is no significant difference in the distribution in terms of states in each income level, which means that the income level should not have a strong relationship with the development of the local museums. However, we still need further evidence to support our hypothesis.
To examine the relationship between location and revenue further, we can use principal component analysis on INCOME15, REVENUE15 (profit-related variables), LONGITUDE,LATITUDE (geographical variables).
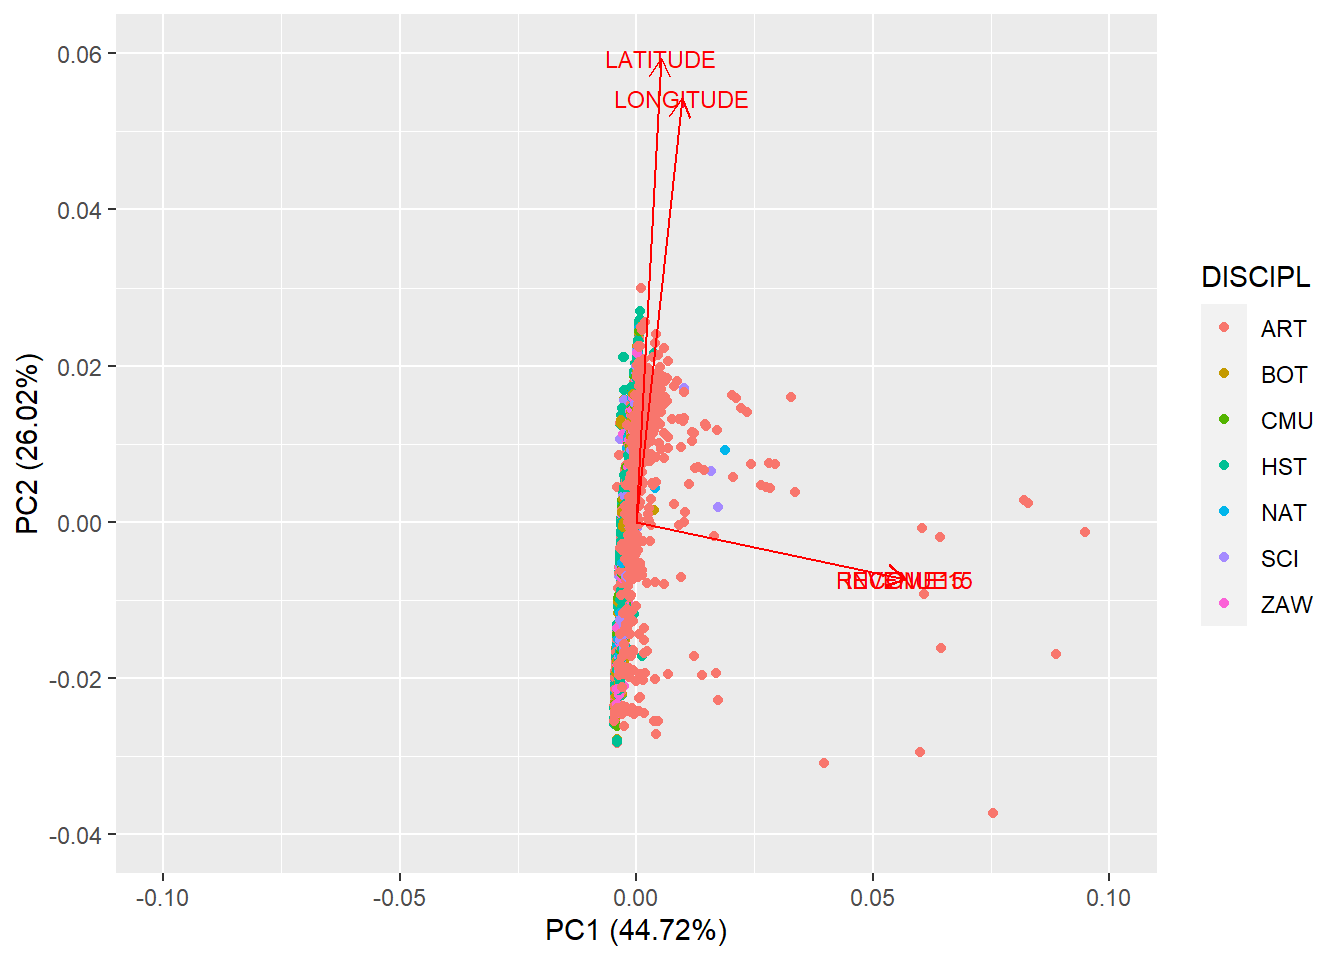
We can see that the vectors standing for the revenue and income are almost overlapping together, which means the data matched the collecting process as mentioned in the official guide: the income is calculated by using the revenue minus the operation cost in that year. Also, we can see that the distribution of museums follows the vectors of latitude and longitude closely, and the museum locations are not correlated with income and revenue since they are almost perpendicular to each other. Hence, the current development of museums is not profit-seeking since there is no relationship between location and revenue based on the above results.
4.1.4 New Museums Trend
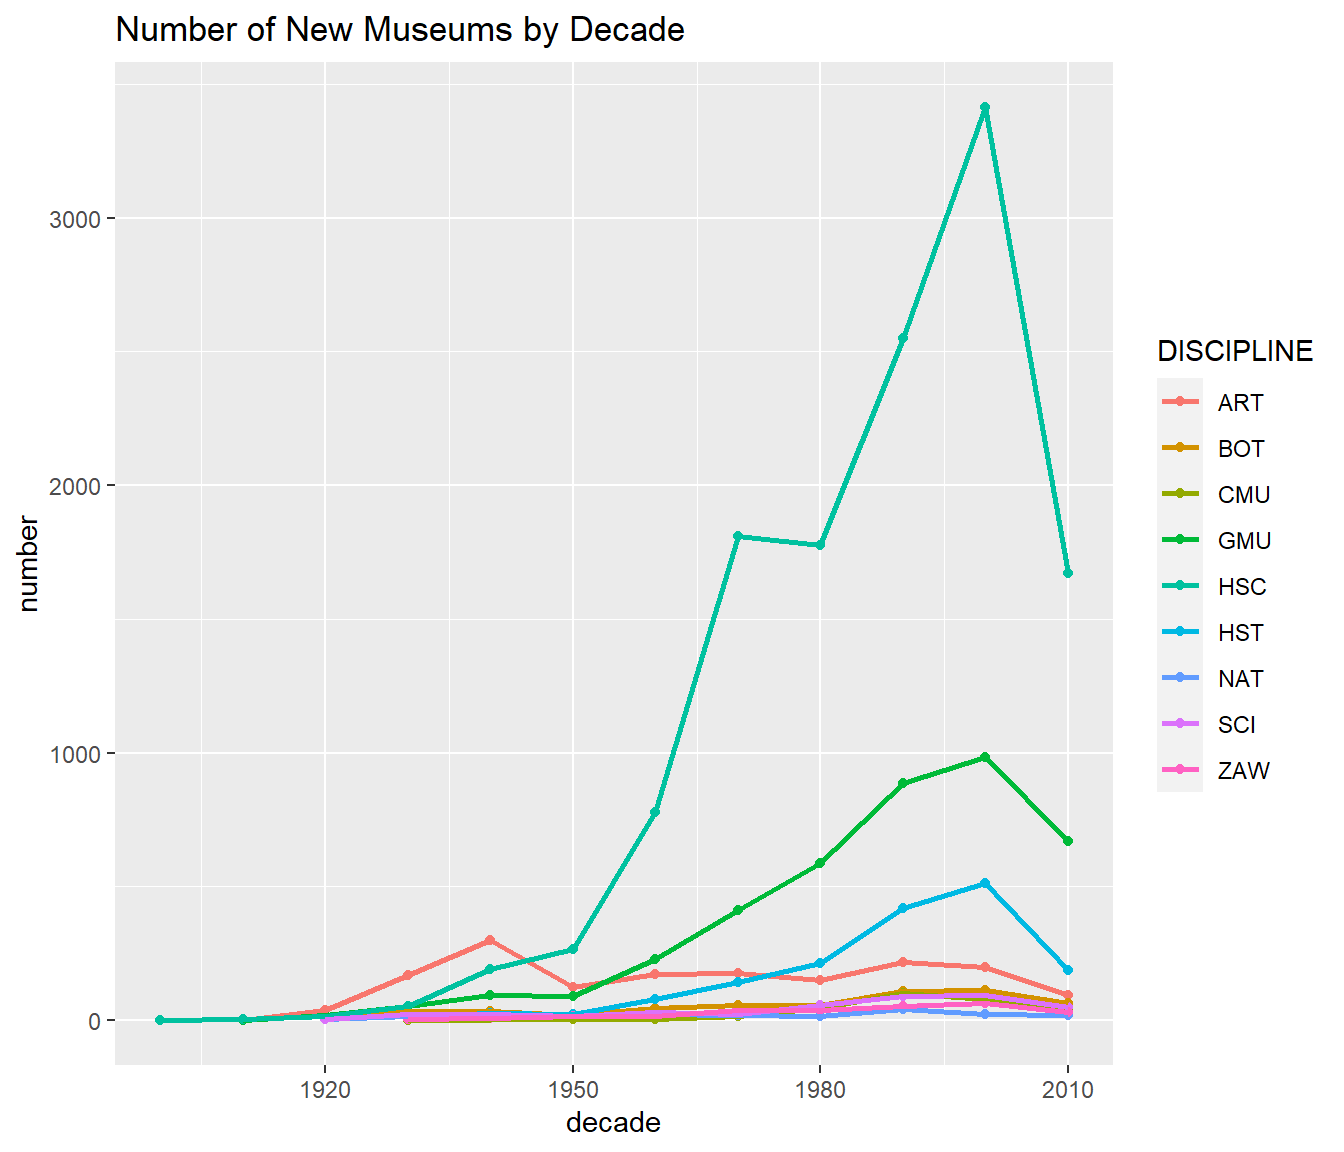
The numbers of most kinds of museums increase slowly since 1920s to 2000s. Since the data is collected in 2018, the new museum numbers cannot present the total 2010s. Before 2010s, there is an obvious increase of HSC from 1950s to 2000s, which indicates that the government established lots of Historical Societies/ Historic Preservation after 1950s.
Besides that, the numbers of GMU and HST also increased a lot. The rapid growth of history related museum reflects that we care about history more and more in recent days. Also, the number of art museum in 1940s has an obvious increase, which means the fashion of enjoying art was prevailing at that time.
4.2 Library in US
4.2.1 Analysis of Library 2020
4.2.1.1 Population and visitors
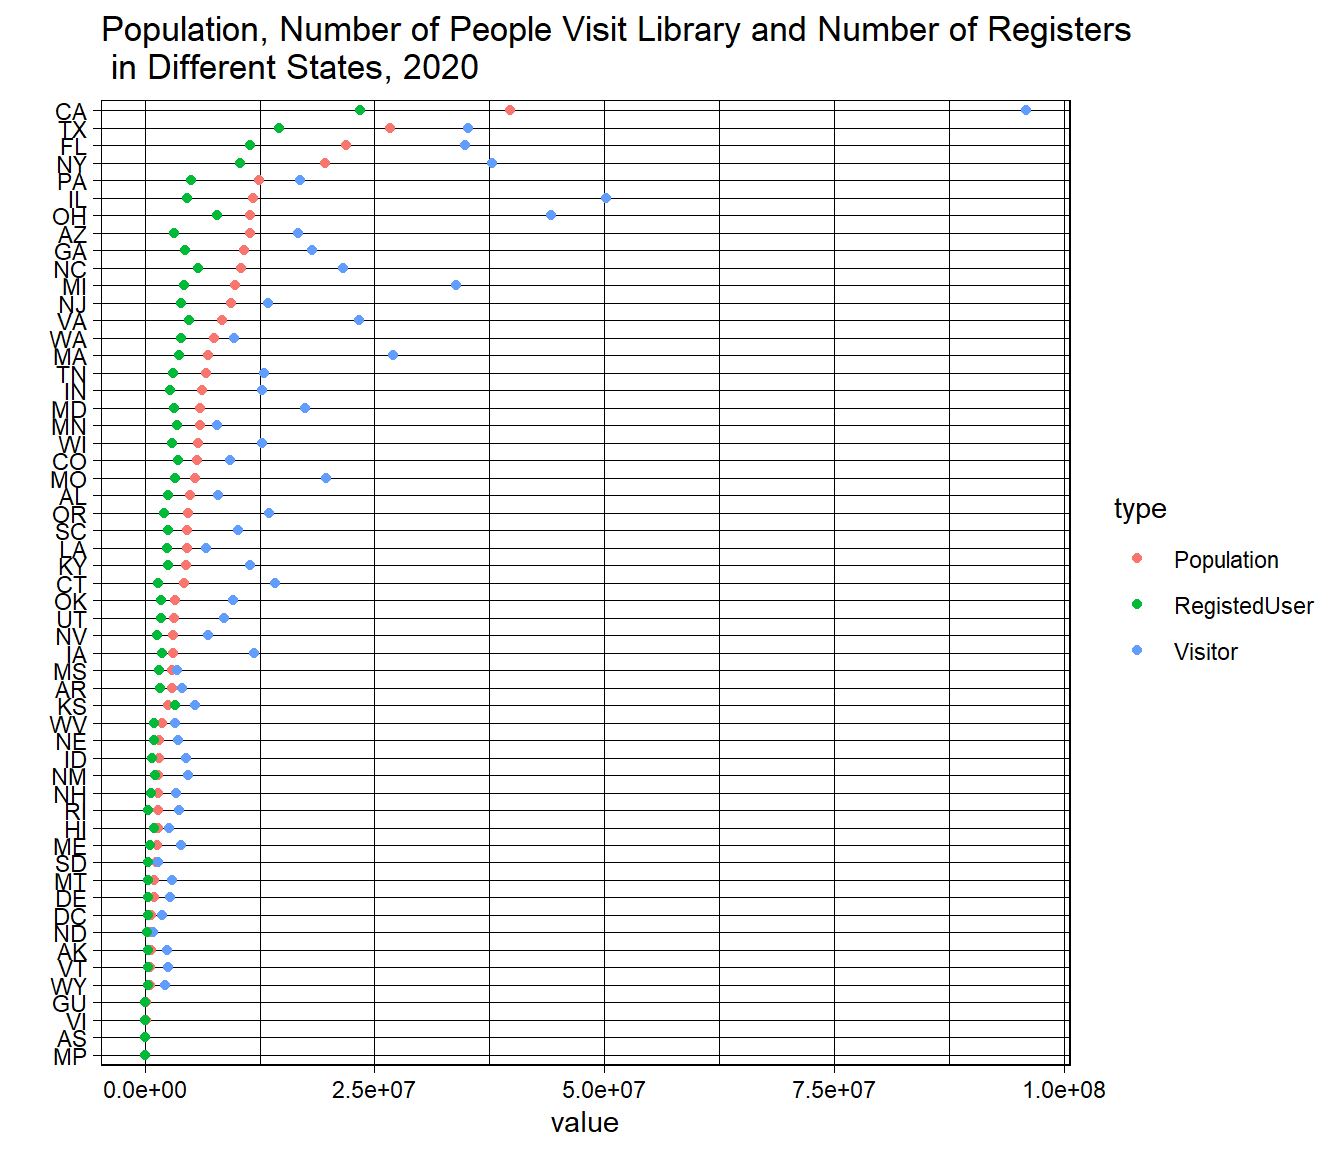
We first analyze the population, number of people visit local library and number of register member of library in each state. The cleveland dot plot is ordered by the population of each state. As we can see from the graph, there is a overall trend of the state has large population tend to have more visitor and register to libraries in the state. In another word, there is a positive correlation between the population and the number of visitors. However, this is not graranteed as there are some state with large population having relatively small number of visitors like Texas and Florida.
4.2.1.2 Number of library
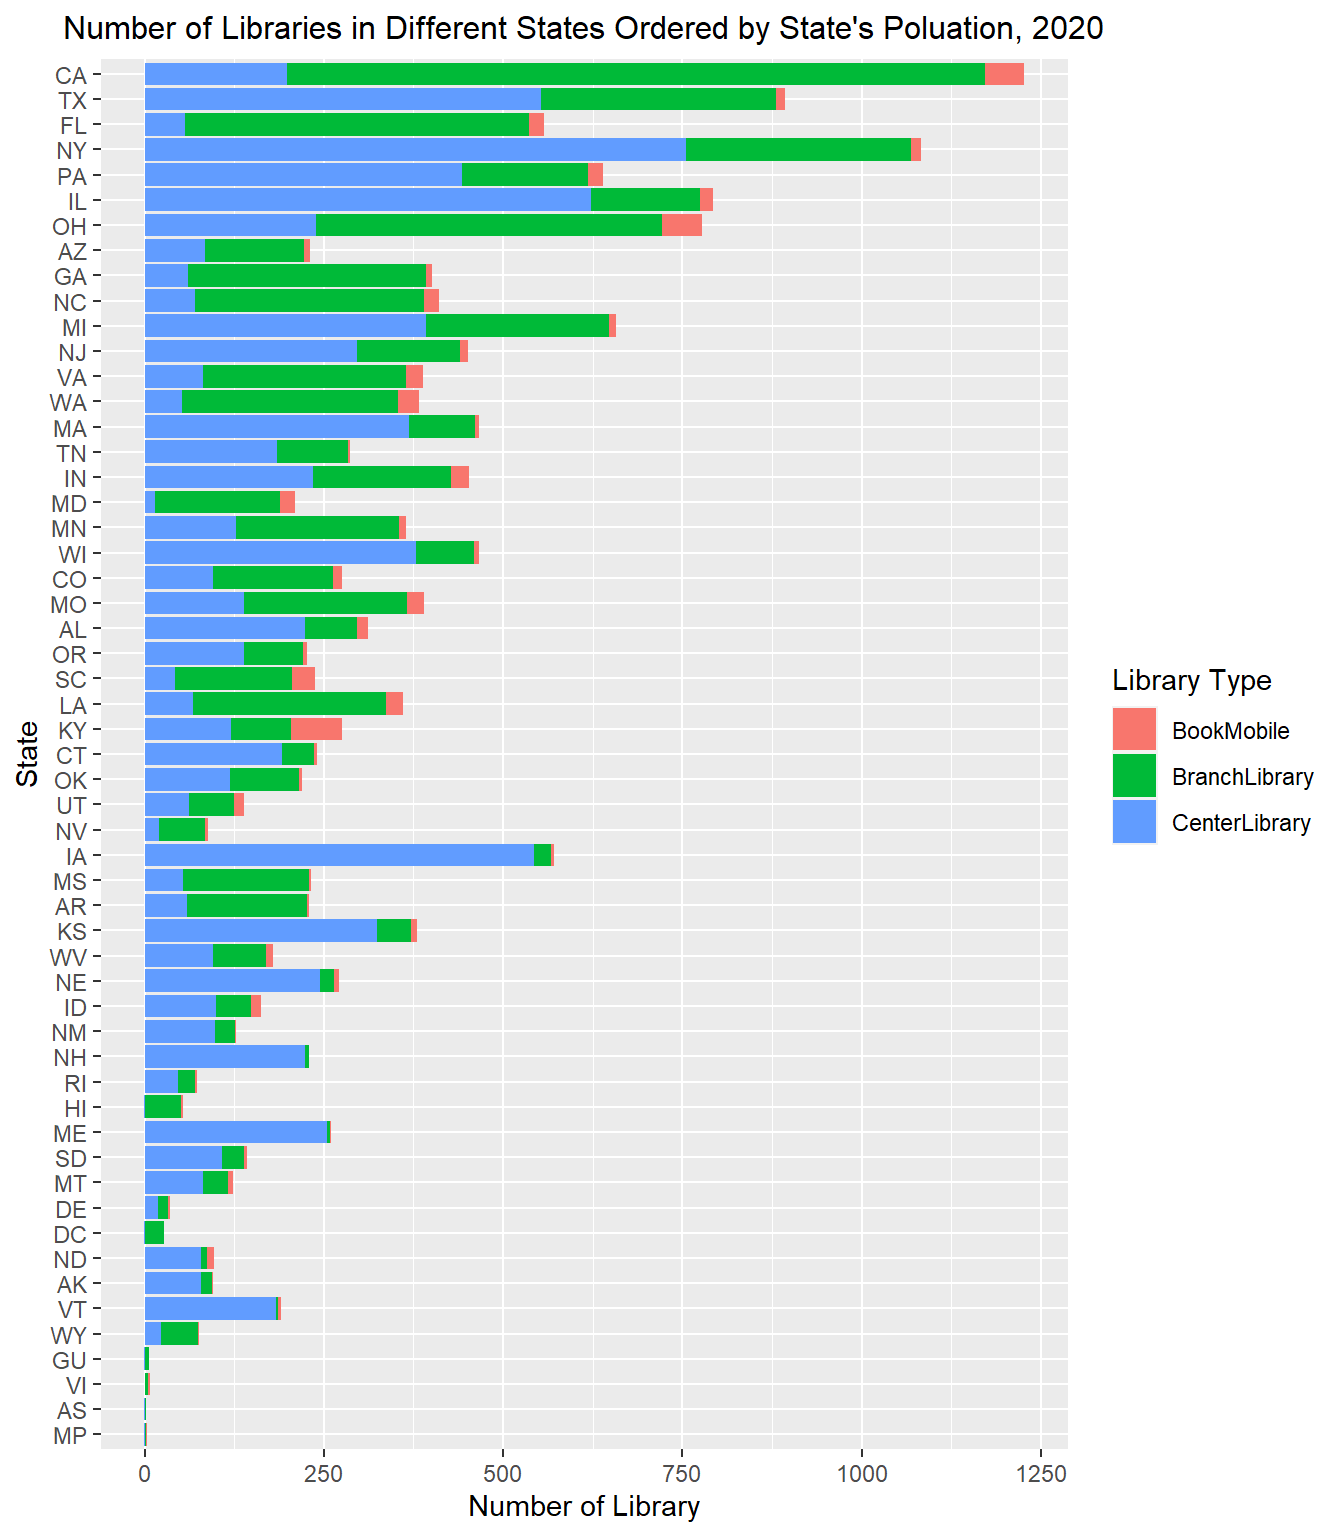
Then, we would like to analyze the number of library in each state. There are basically three kinds of libraries: center library, branch library and book mobile. We use a stacked bar chart to show the number of library in each state and the bars are ordered by the population of each state. As we can see, there is also a positive correlation between the population of each state and the number of library. However, this is not graranteed as there are some state with large population having relatively small number of library like Florida and Arizona.
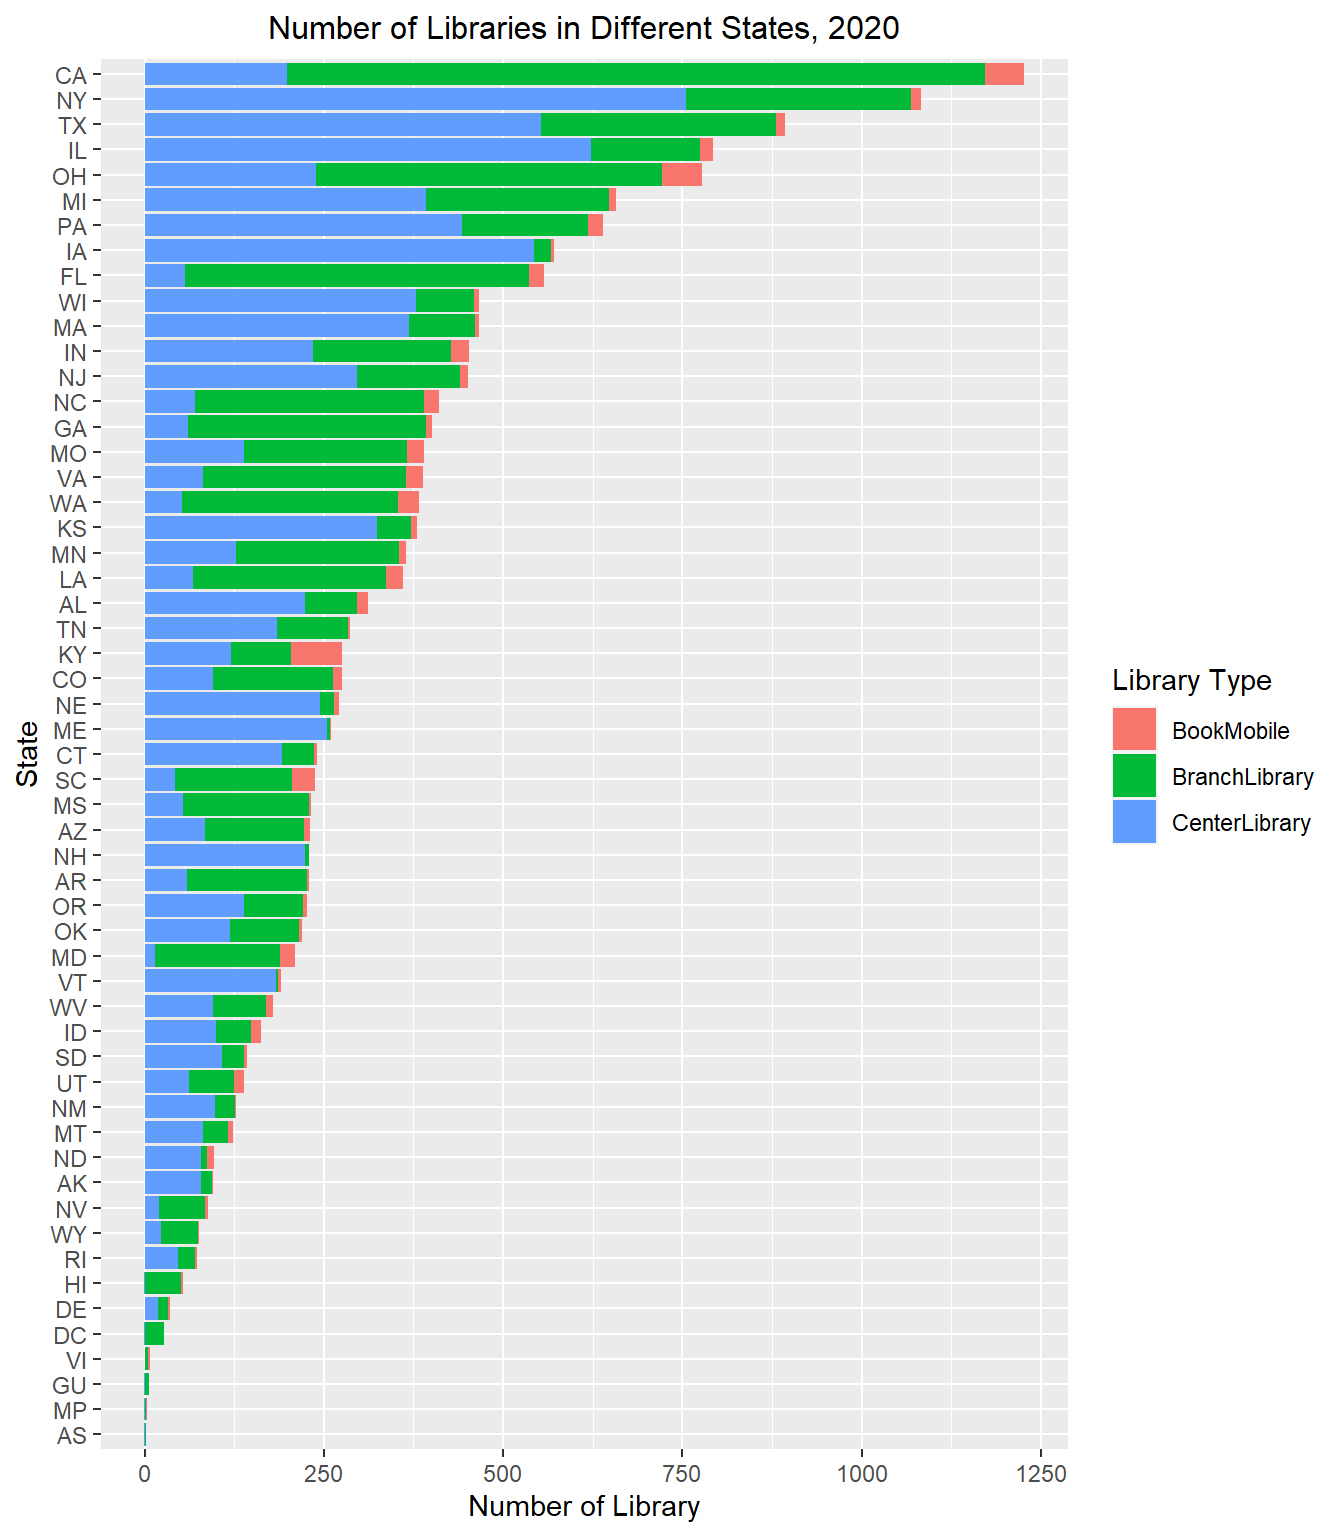
In the following part, we are interested in other aspect of different state’s libraries which is more closely related to the number of library instead of the population. To better analyze the patterns of these variables, we make a stacked bar chart of the number of library in each state ordered by the total number of library. As we can see from the graph above, the proportion of different kind of libraries are different among different states. For example, California has a large proportion of branch libraries while New York has more proportion of main libraries. This shows that the structure of library systems of different states are different.
4.2.1.3 Collections of Libraries
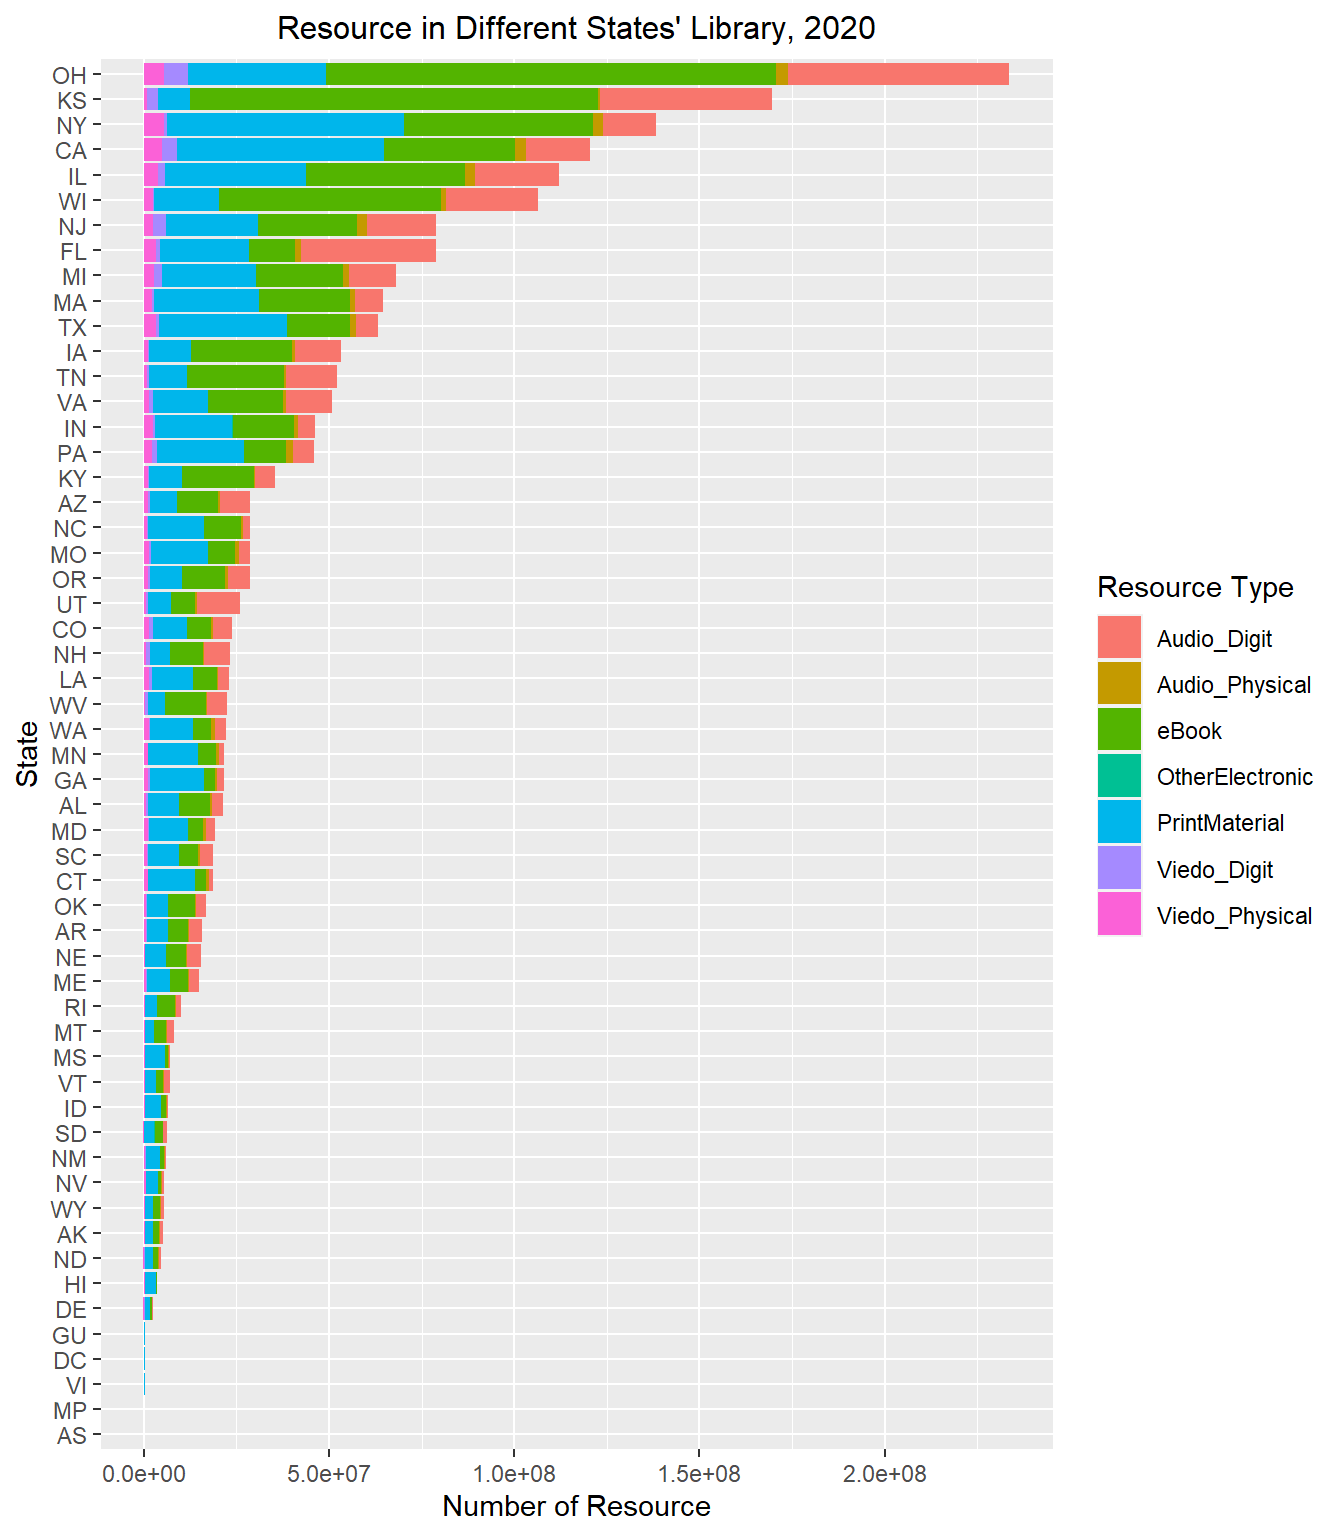
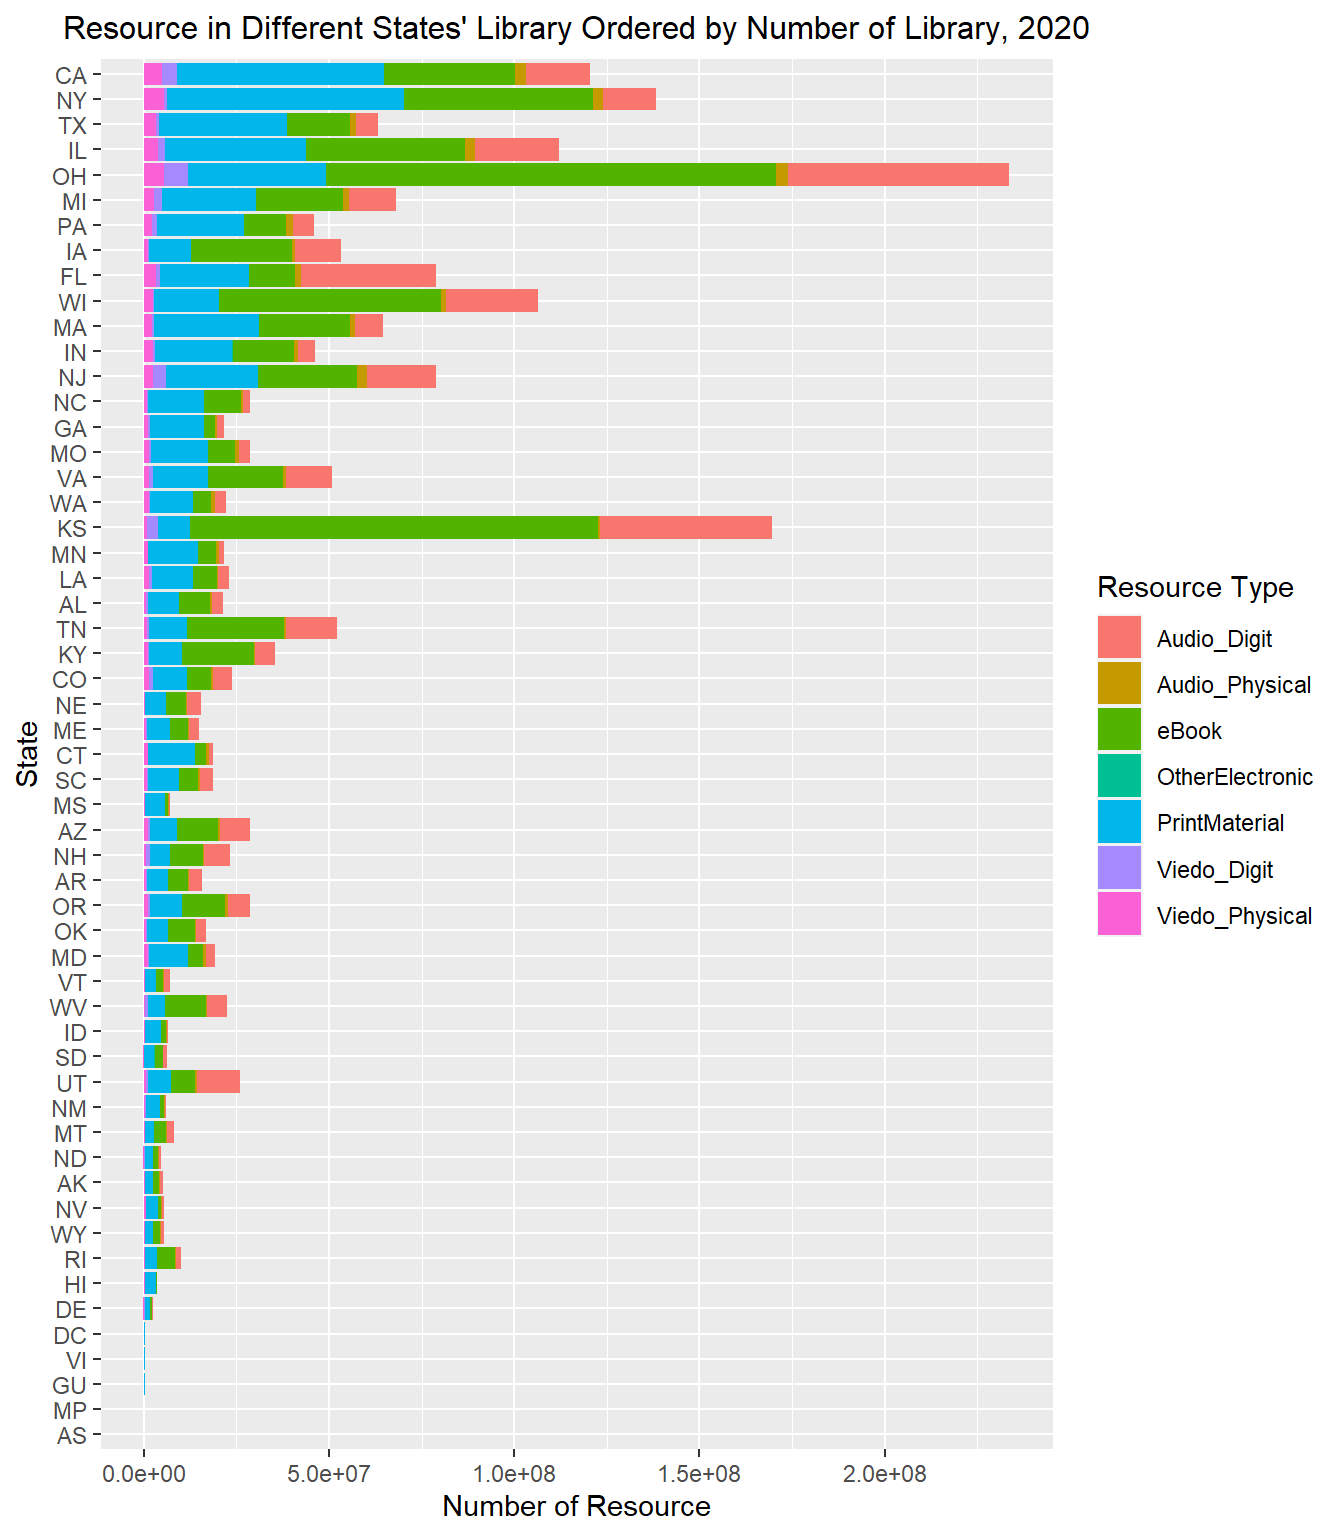
We first use a stacked bar chart ordered by the add up number of resource of each state. Then we draw a stacked bar chart ordered by the total number of library in each state to show the relationship between number of resource and number of library while keep the pattern of different kind of resource and the state’s name.
There are several kinds of resource in each library: printed material, audio resource in physical format or digital format, video resource in physical format or digital format, ebook, state digital resource and other electronic resource. As the last two kinds are relatively small, we combine them together and set as a new group ‘other digital resource’.
The stacked bar chart is sorted by the number of library in each state. As we can see, there is a positive correlation between the number of library and the total resource owned by local library from the stacked bar chart sorted by the number of library in each state. However, there are also many outliers like Ohio and Kansas which own much more resource than expected.
Further more, we can see from the graph that different state’s library’s resource pattern are different. Some of the state has more proportion of electronic resource while some of the libraries have more proportion of printed material.
4.2.1.4 Events Hold by Libraries
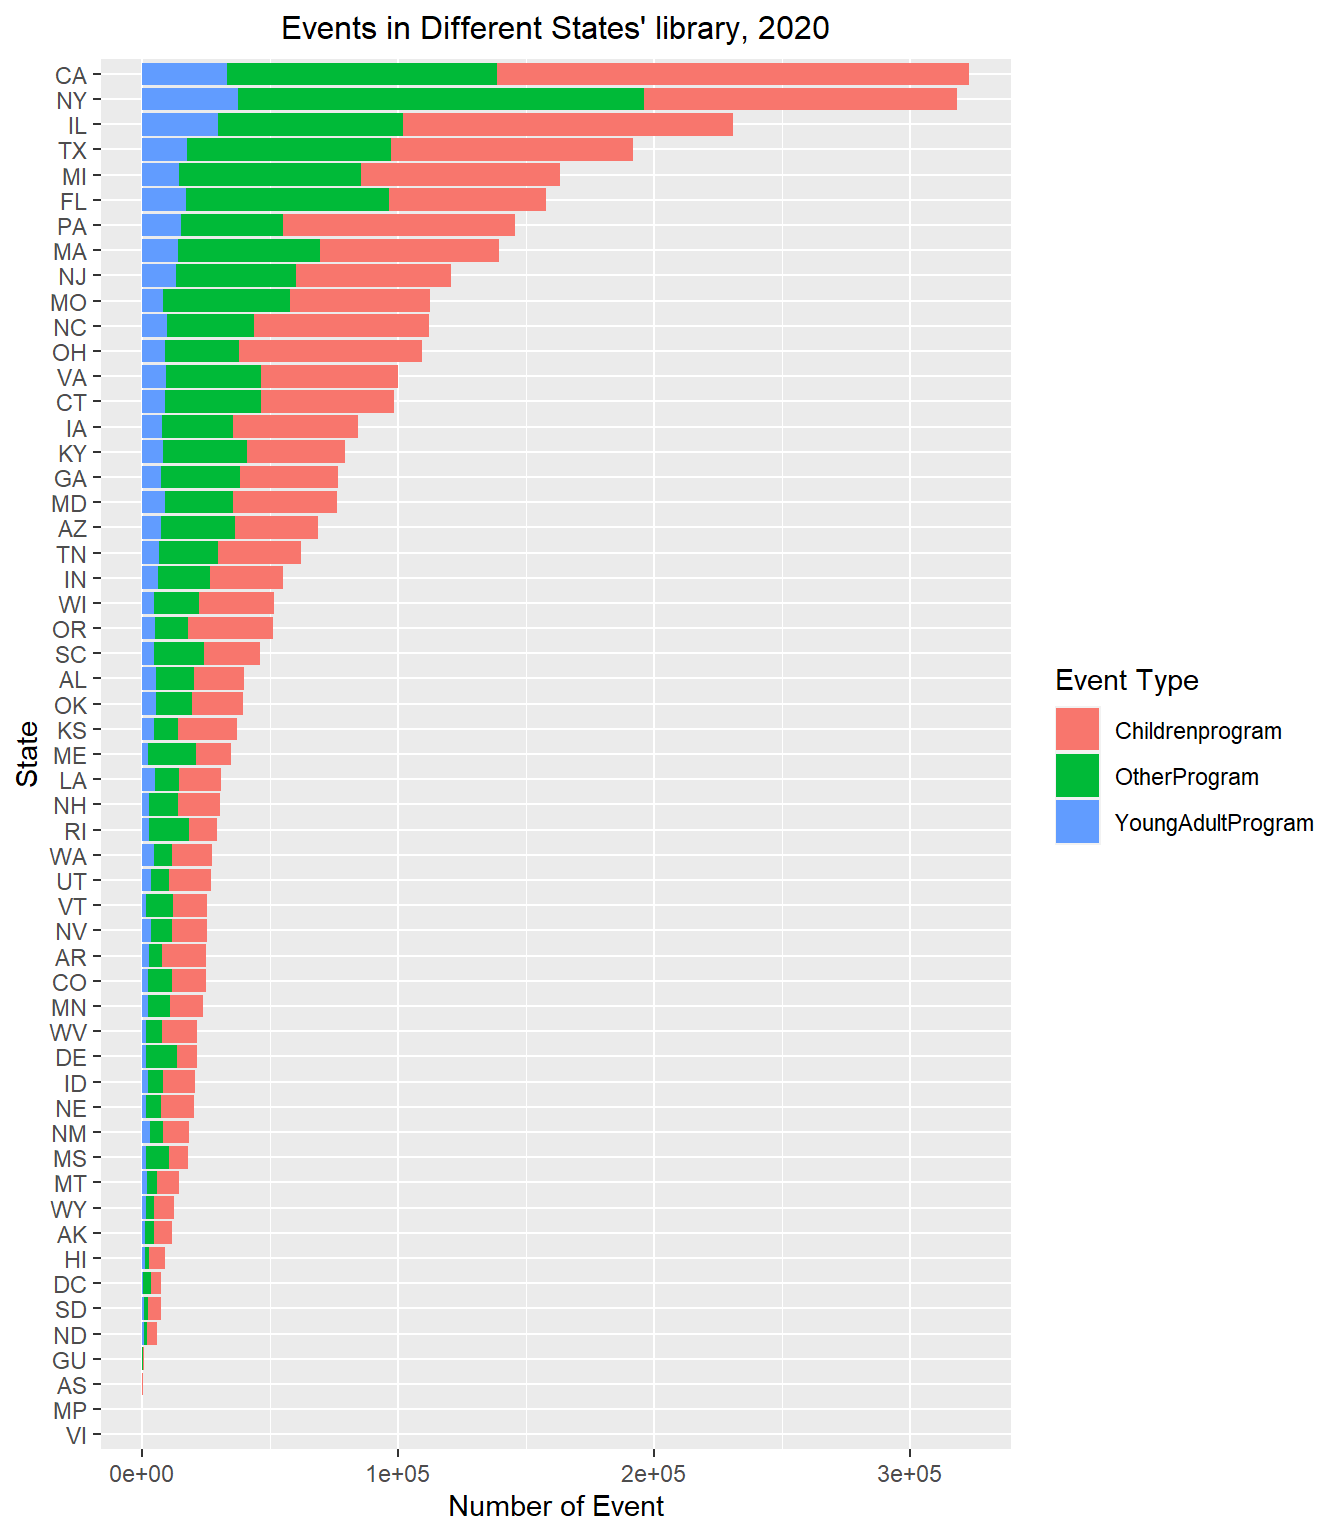
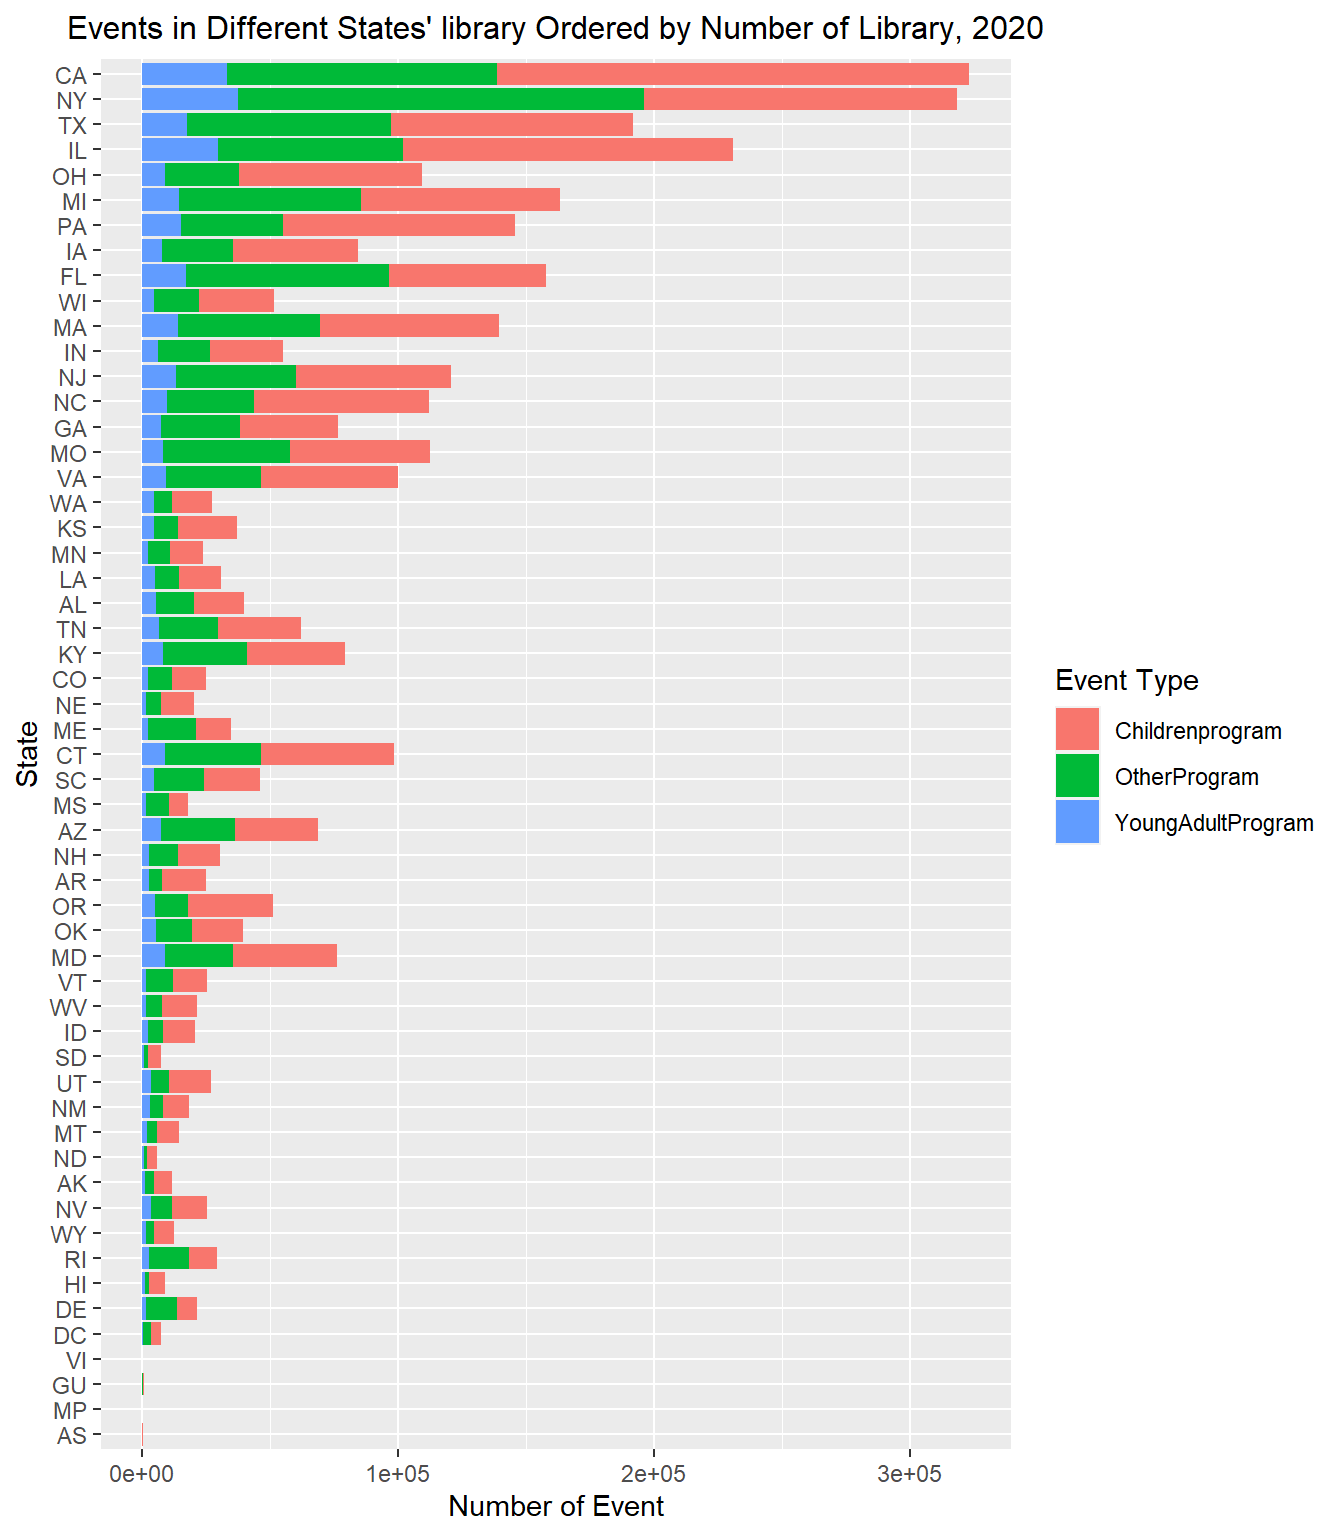
We also use two stacked bar chart one ordered by the add up number of events hold by libraries of each state and the other ordered by the total number of library in each state. Thus we can show the relationship between number of event and number of library while keep the pattern of different kind of resource and the state’s name.
Most of the libraries hold reading event for readers. There are events for children, young adult and others. As we can see from the graph above, state with more number of library tend to have more reading event over state. Among all the events, most states’ library tend to have more program for children except New York and Florida.
4.2.1.5 Revenue
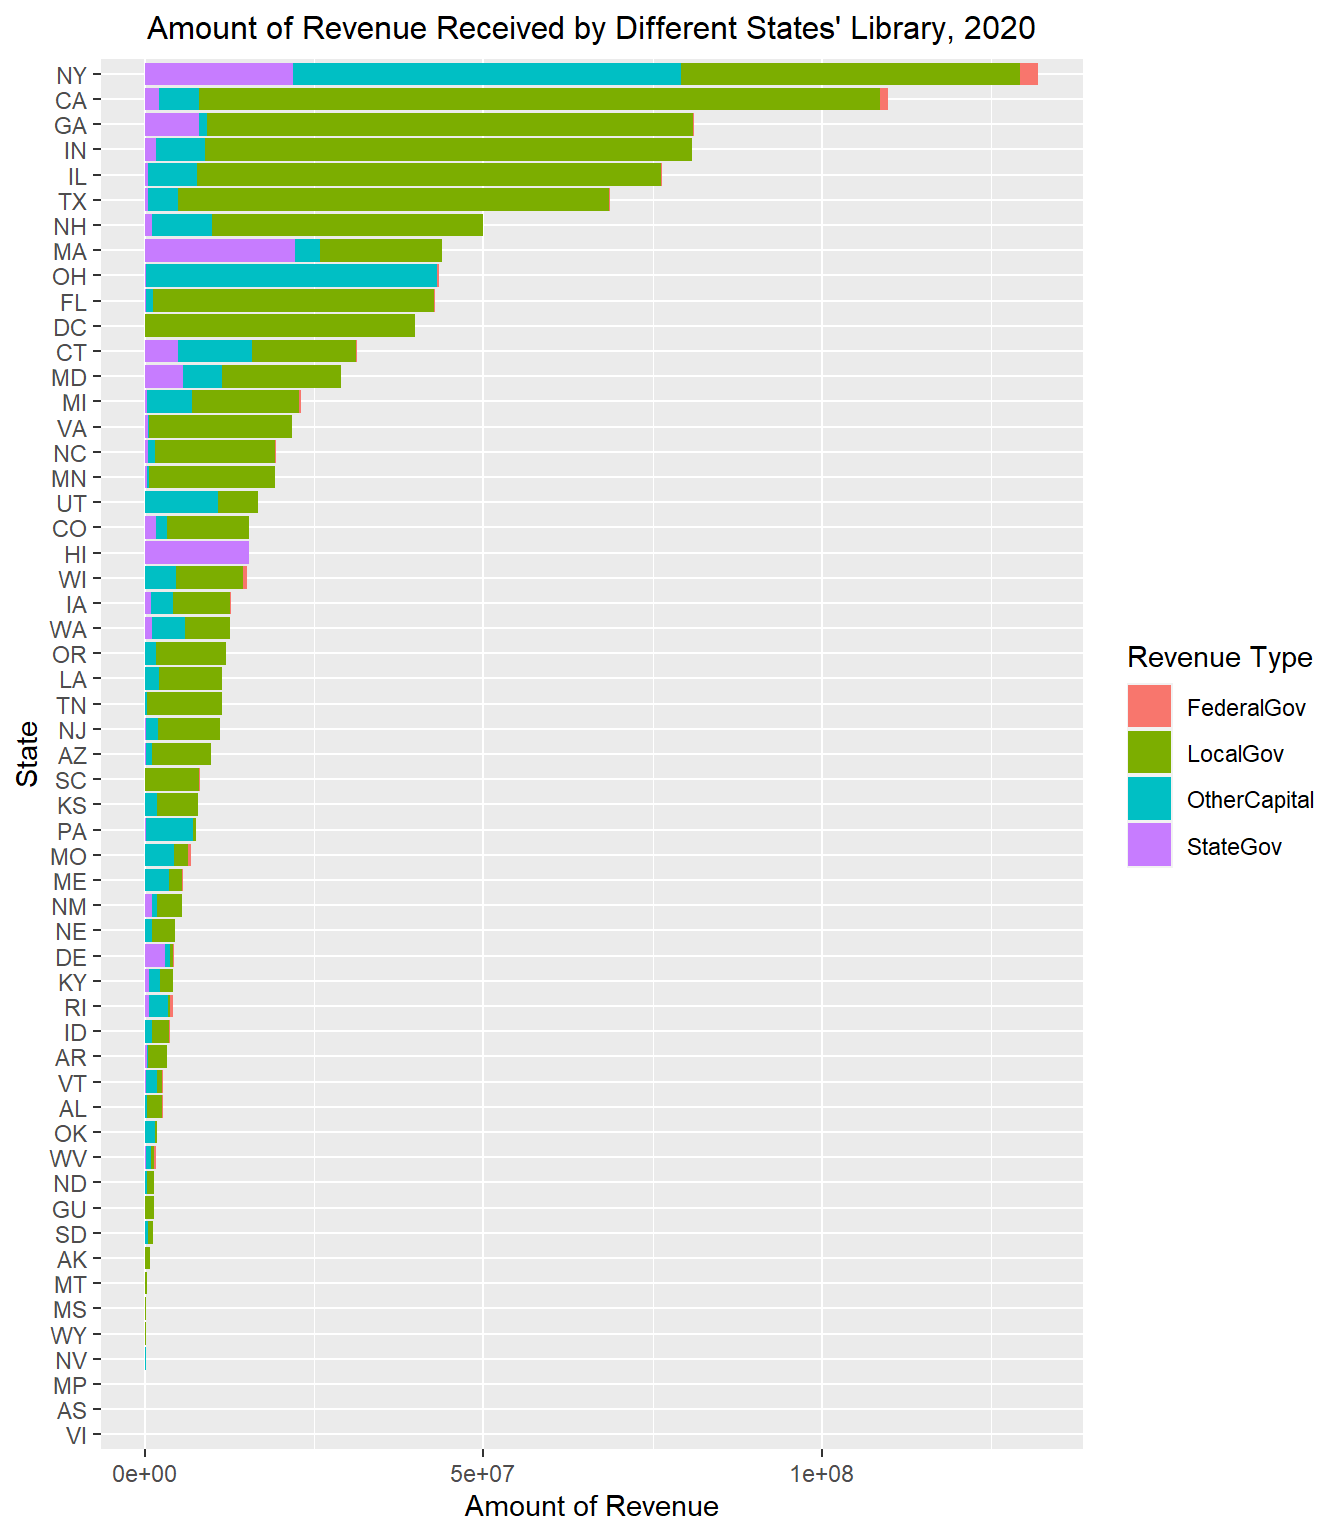
We first use a stacked bar chart ordered by the add up number of revenue. Then we draw a stacked bar chart ordered by the total number of library in each state to show the relationship between revenue and number of library while keep the pattern of different kind of resource and the state’s name.
As we all know that most of the libraries are free for residents to visit and a large proportion of money are from revenue. There are four kinds of revenue that a library can have, which are revenue from federal government, state government, local government and others.
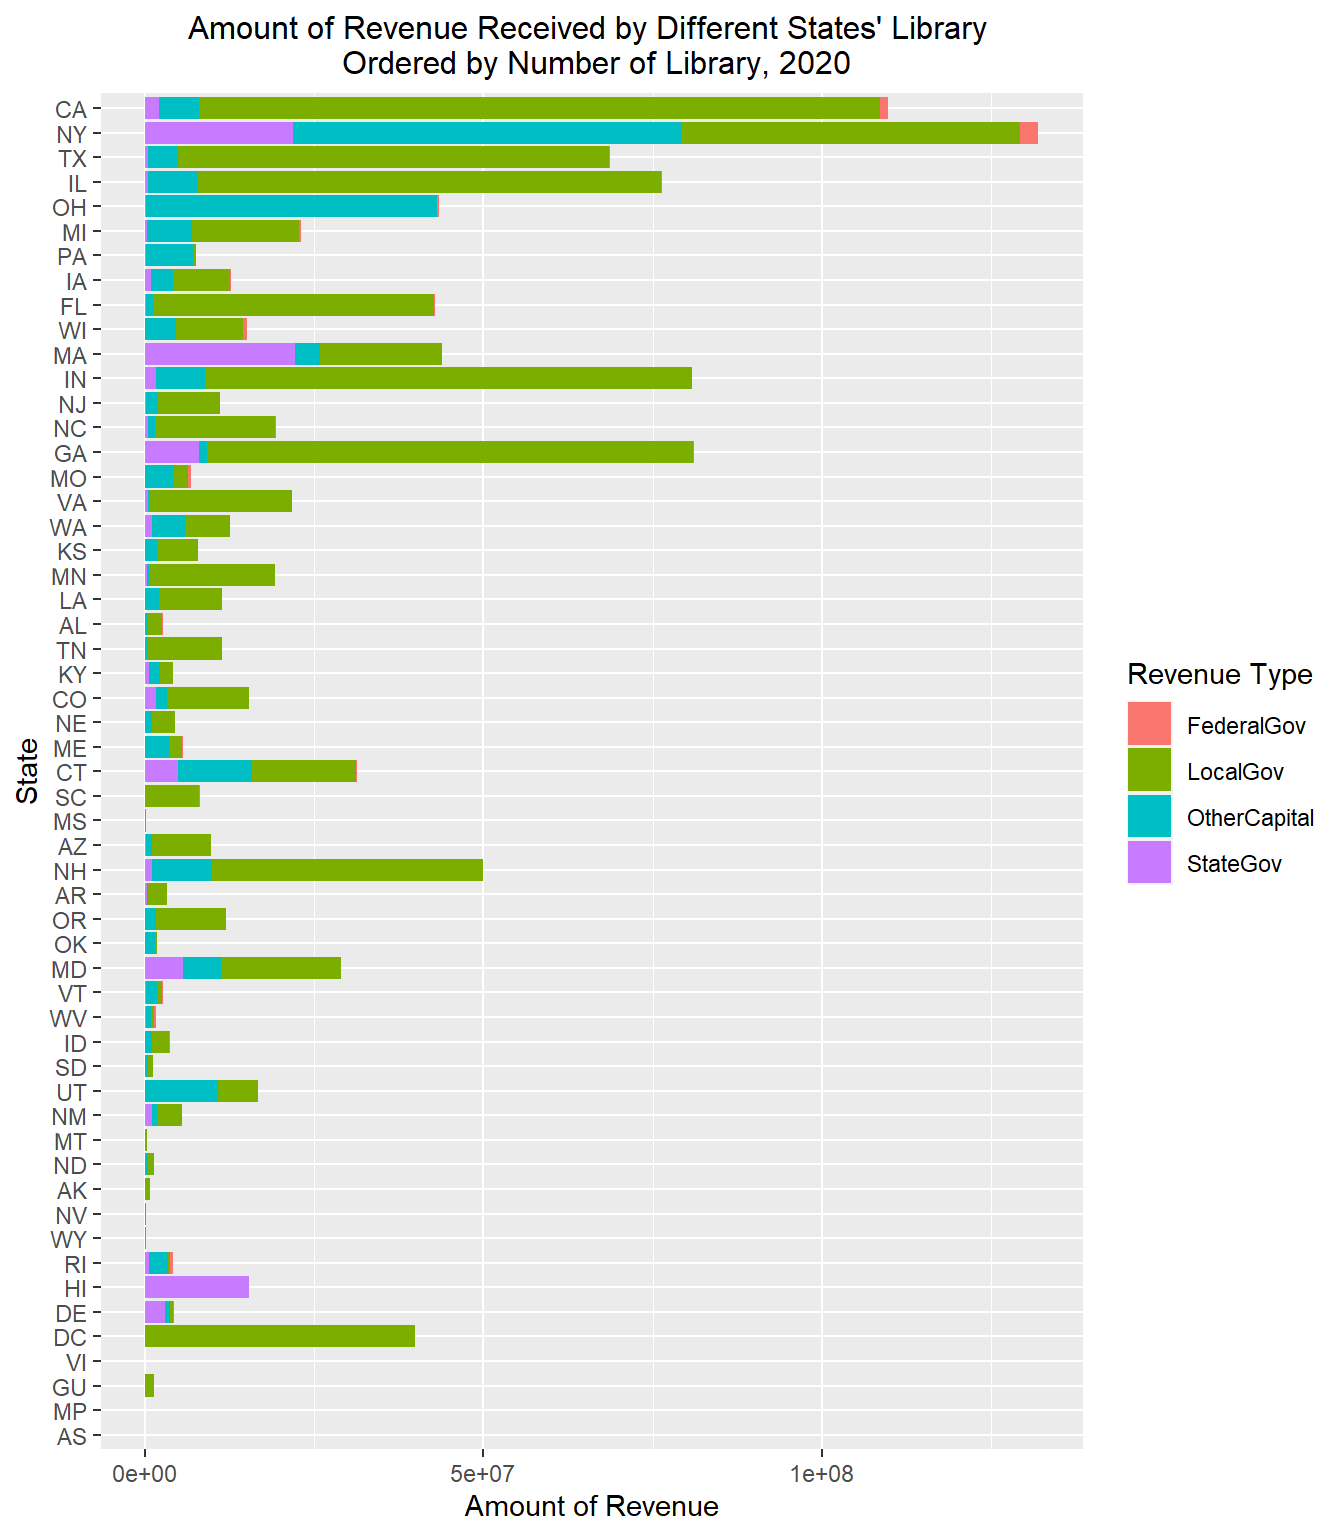
As we can see from the graph ordered by number of library, the relationship between the number of library and total amount of revenue is relatively weak comparing with other characters we analyzed before. This shows that some of the states’ library receive more revenue than others. Most of states’ library receive more revenue from their local government while there are several state receive more revenue from other way. We can also see that New York, Massachusetts and Hawaii’s libraries receive relatively large amount of revenue from the state government which some how reflect the importance put on libraries or other entertainment and culture by the state.
4.2.1.6 Overall Analysis
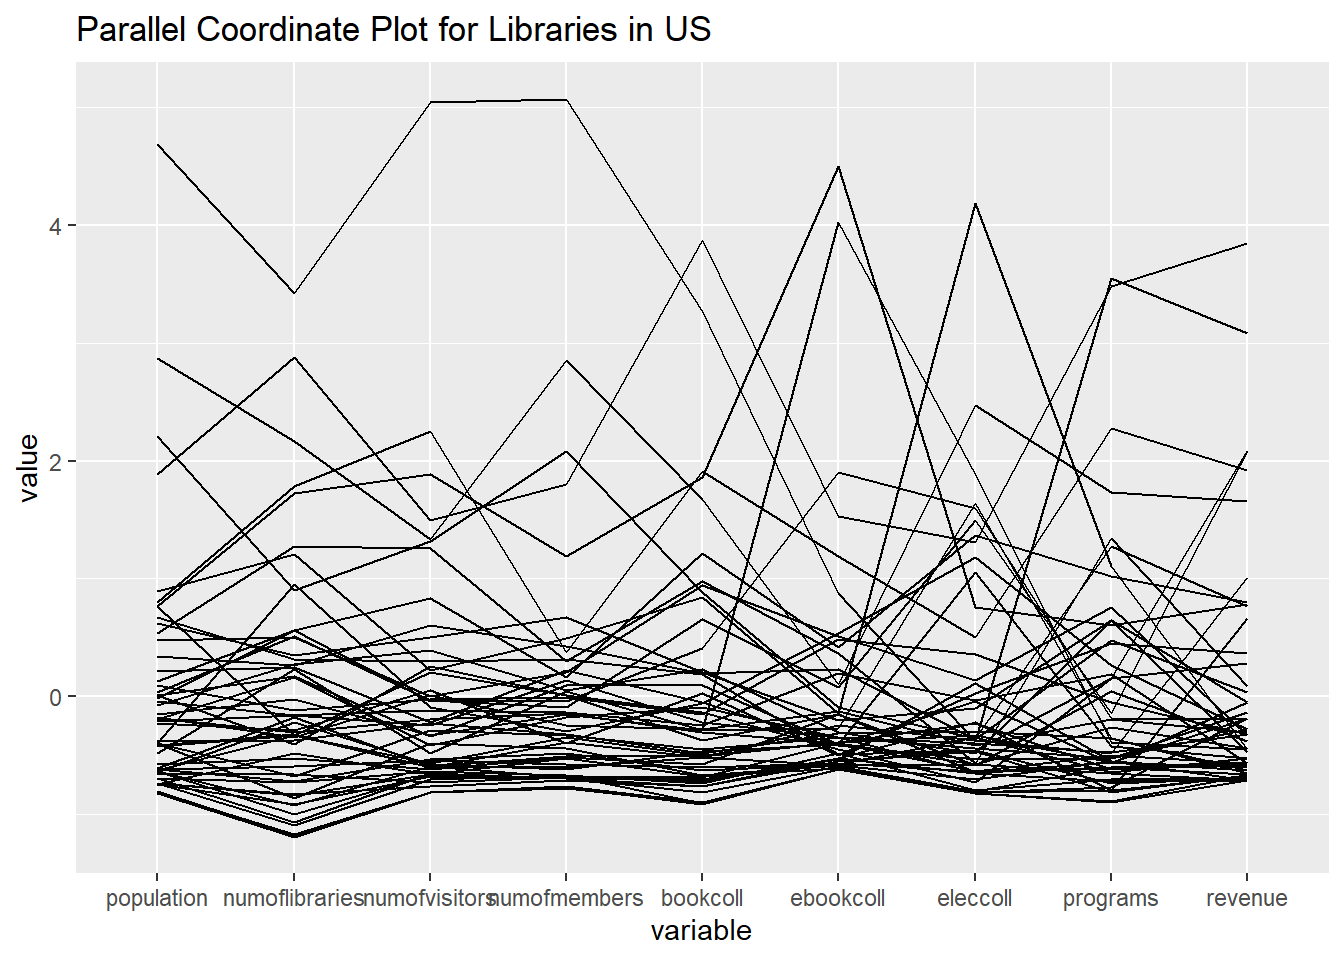
We put all the variables we discussed together including the population, number of visitors, number of register, printed material resource, ebook resource, electronic resource, programs and revenue. We can see from the parallel coordinate graph that the relationship between each variable are basically positive correlated for most of the states and each variable has outliers.
California is outlier for all the variables regarding the number of people including the number of visitor, member of library. New York has biggest volume of books while Kansas and Ohio has really high number of ebook and Pennsylvania has highest number of other electronic resource. California and New York receive highest amount of revenue. As we can see from above, some of the state dominate more than one variable like California and New York while more than half of states have relative low value in all of the variables which shows a inequality development of library in different state.
As we can see from the spatial graph, the state with higher number of library are clustered on the east side of the country especially the north east region while the state in the west east have relatively low number of library.
4.2.2 Time Series Analysis
We also interested in the change of data during past 15 years as the world changed quickly with the development of internet and there all kinds of entertainment in people’s life. Thus, we make a series of graph to show the change in number of library, number of people visit library annually, and the number of books and ebooks in library. As our data is annual data, we didn’t transform it into ‘date’ data type but keep it as integer.
4.2.2.1 Population change in past 15 years
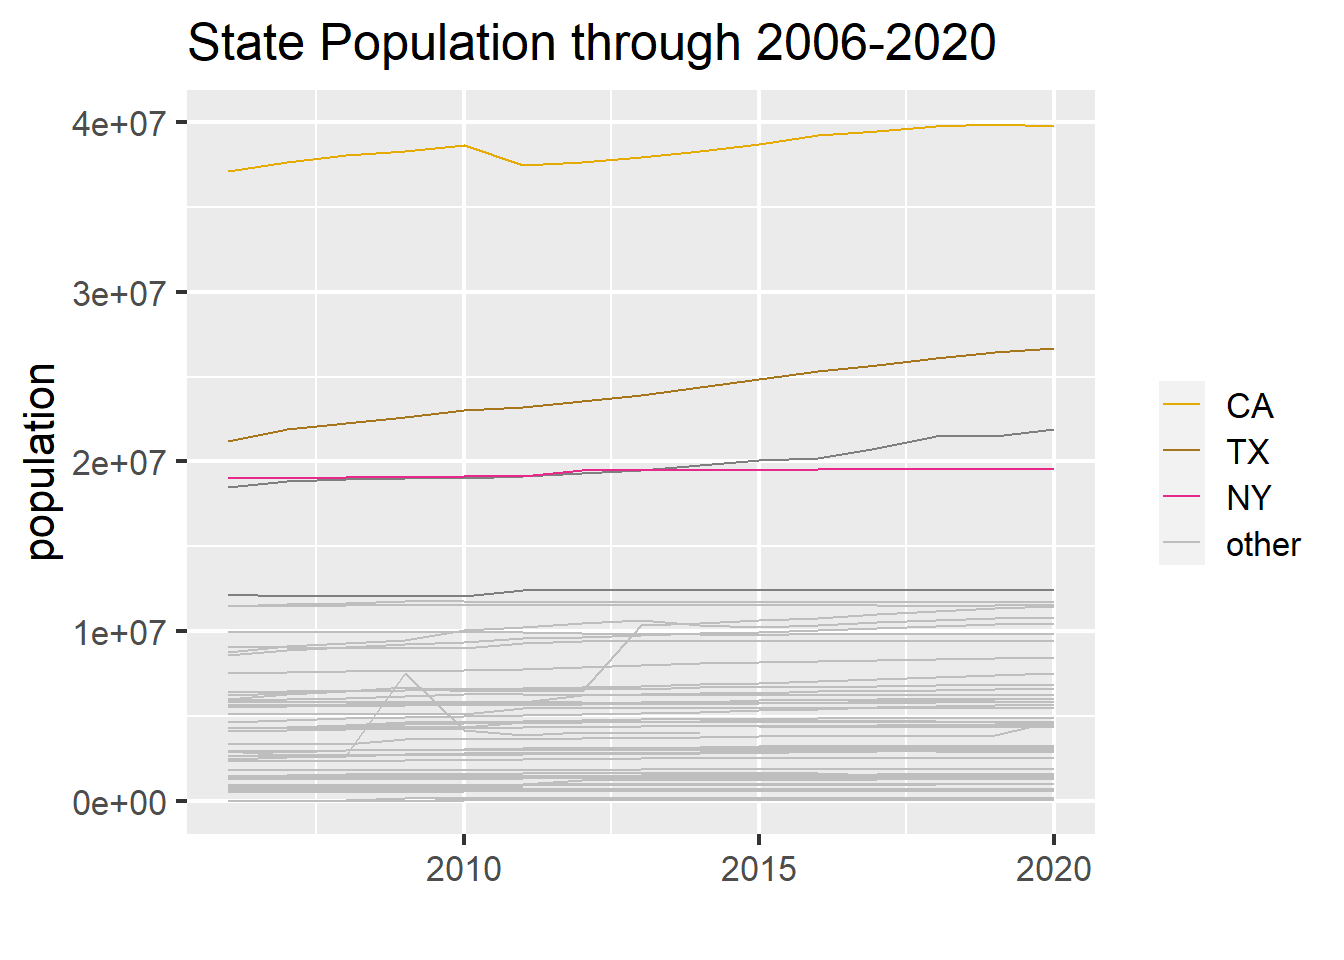
First, we show that the population of each state has a slow but stable increasing trend during the past 15 years. Although the increment is not so big except several big state. The top five population dense states are California, Texas, Florida, New York and Pennsylvania. We didn’t show Florida and Pennsylvania in the graph with particular corresponding color as these two states don’t rank top in the other statistic value regarding library.
4.2.2.2 Number of Library change in past 15 years
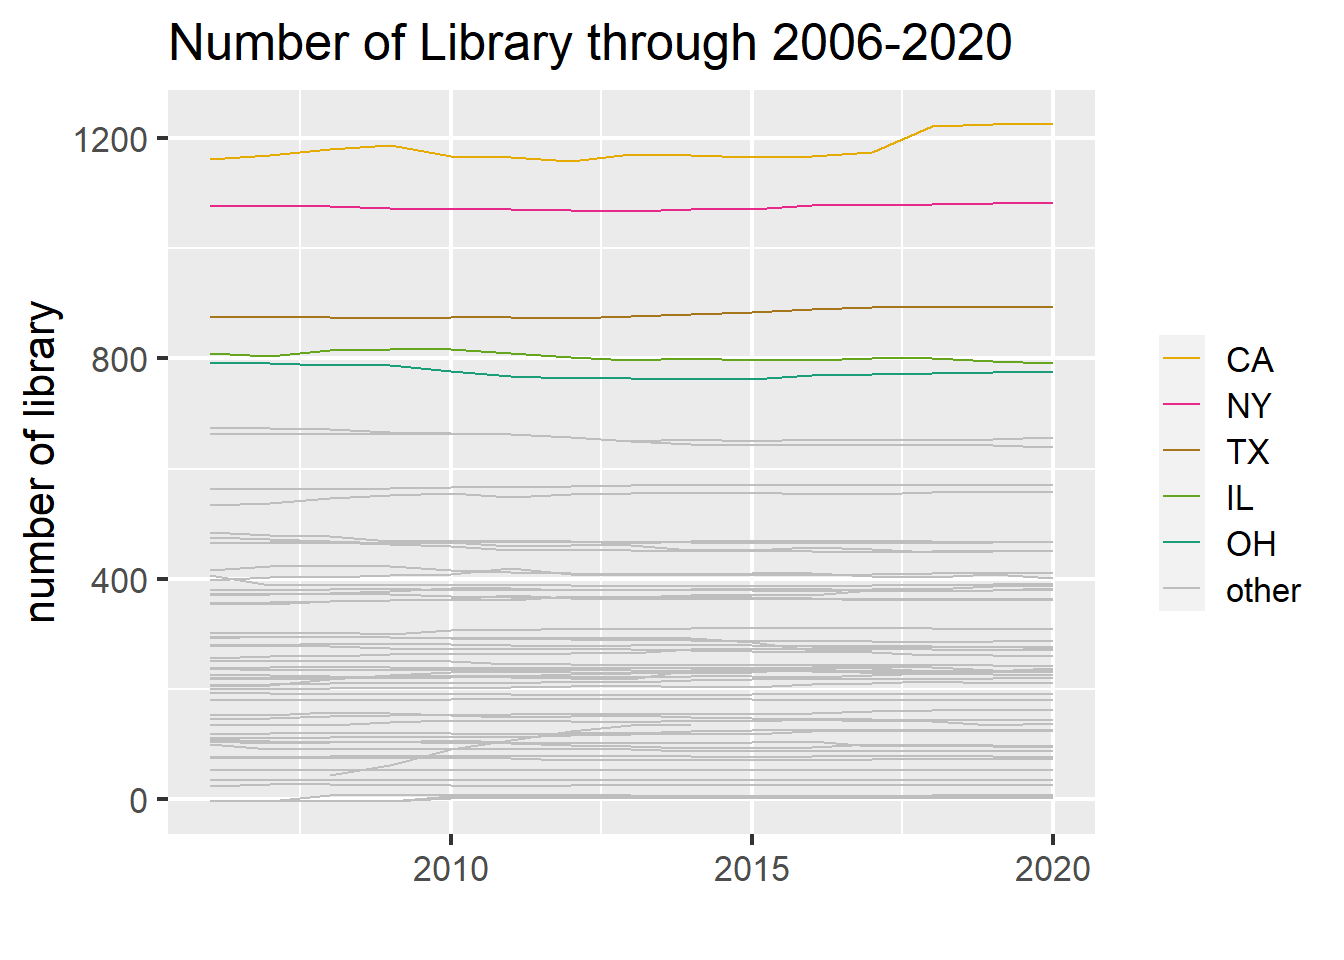
Then, we compare the number of library in each state and we can see that most of states’ number of library didn’t change during the past 15 years.
4.2.2.3 Number of people visit library

After we known that the population didn’t decrease but indeed increased in most of states and the number of library didn’t change, we can see that the proportion of population decreased during the past 15 years. In other word, less people visit library during the past years which may partly due to people can search information more and more conveniently on cellphone or computer and have more ways to relax during their spare time. It is also very likely that people live better life now and they can afford buying their own copy of book instead of borrow one. However, comparing with the decrease in 2020, the decrease trend is much more subtle which means that there are still lots of people go to library before the pandemic. The covid-19 has more impact on whether people would like to or whether they can visit a library.
4.2.2.4 Printed material change during past 15 years
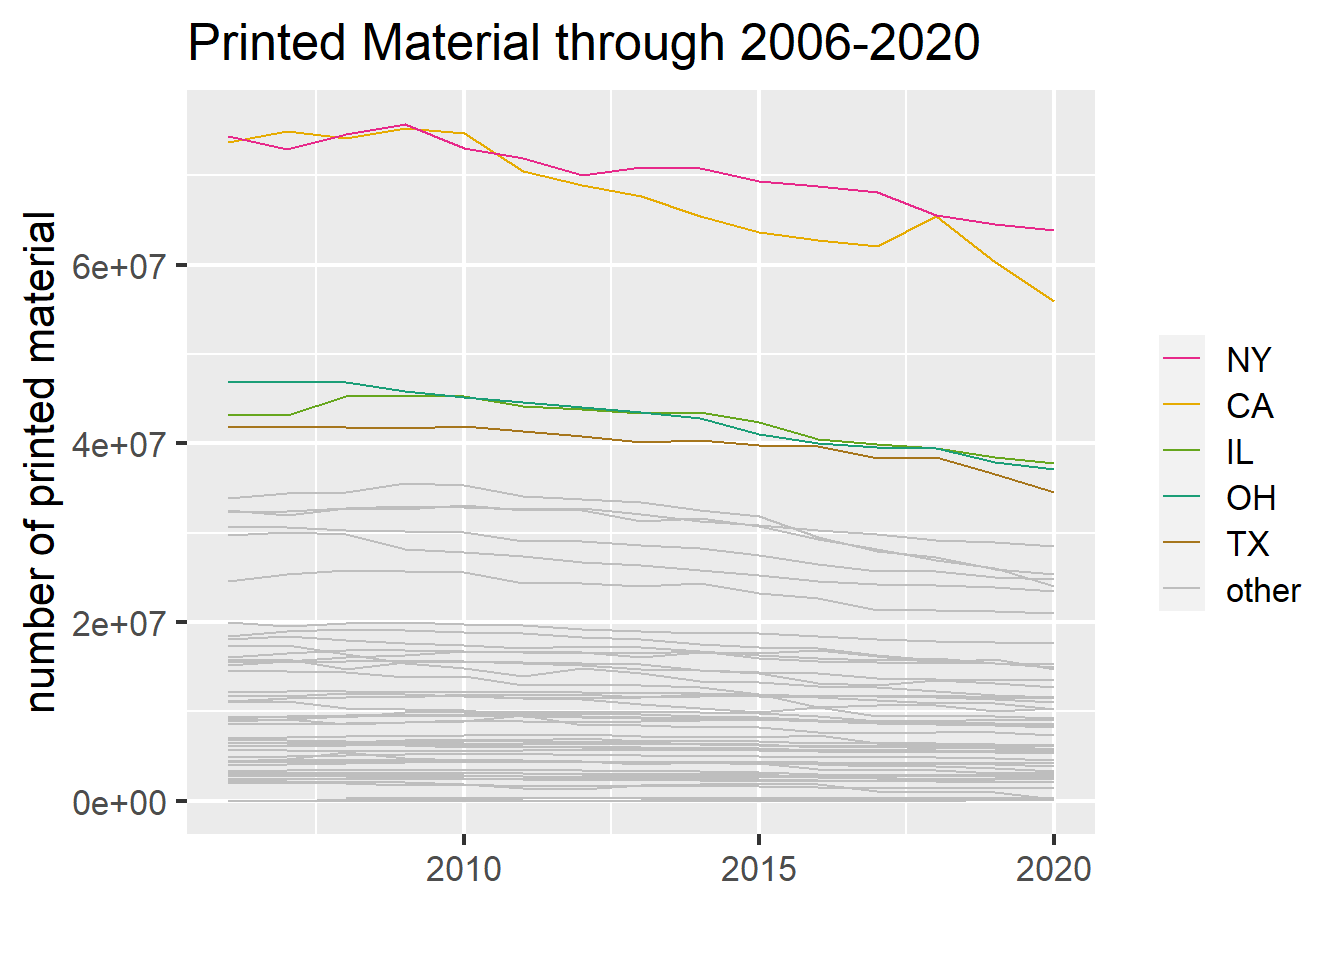
Then, we can see that the collection of books in some state’s library has a decreasing trend during the past 15 years which is especially clear in some of the state has large volume of books in the past. This is quite surprising outcome as it seems unimaginable that people in the library throw away books.
4.2.2.5 Number of ebook change during past 15 years
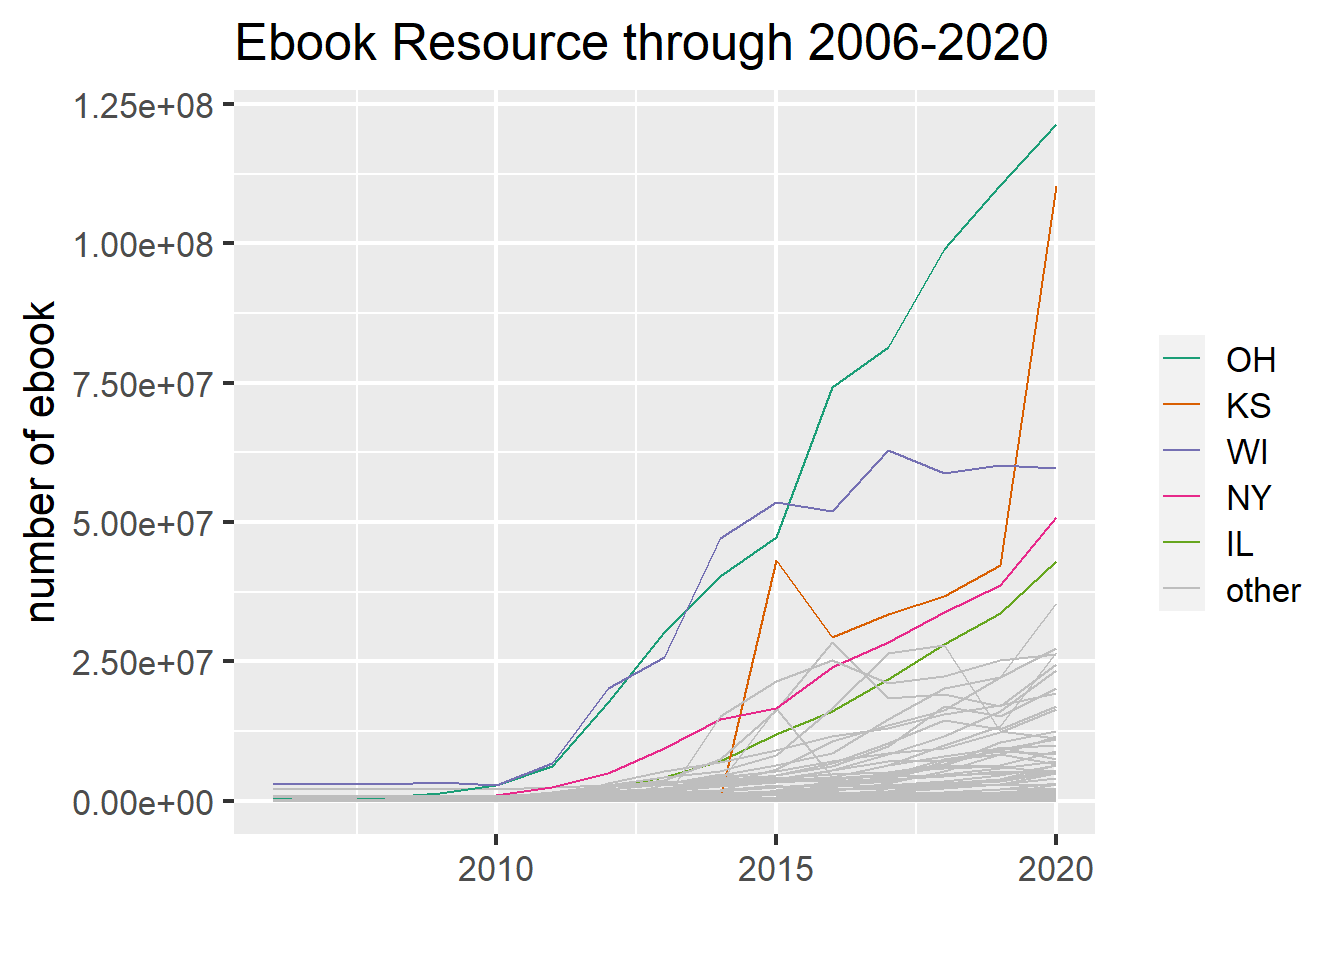
On the contrary, we can see a quick increase in the collection of books in most of state’s library during the past 10 years. Ebook came out around 2010 and became more and more popular during the past years. There are several state ended with a really large number of collection of ebook which shows they put a lot of importance on this kind of resource provided to people. We can also specify that the state with relatively large collection of ebook are also those with large collection of printed materials which show that a state kind of support the development of library.
4.3 Museum and Library in US
4.3.1 Museum map
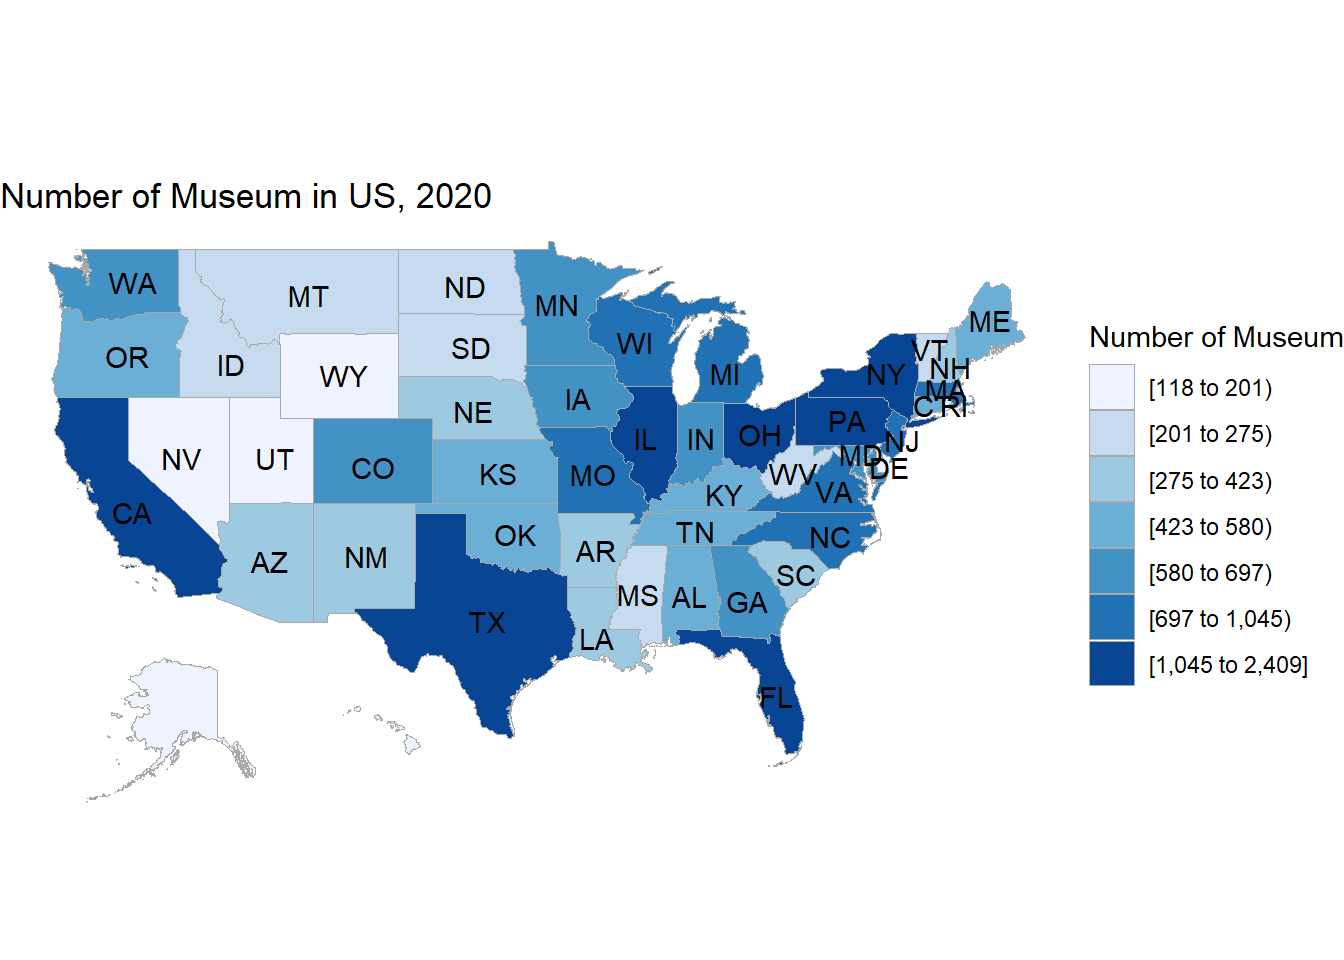
It shows that California, Texas and New York states have obviously more museums than other states, the numbers are over 1600. There are more museums in the east than west, and more in the outside states than states in the middle. Especially, in Delaware, Alaska, Utah, and Nevada have under 160 museums.
4.3.2 Library map
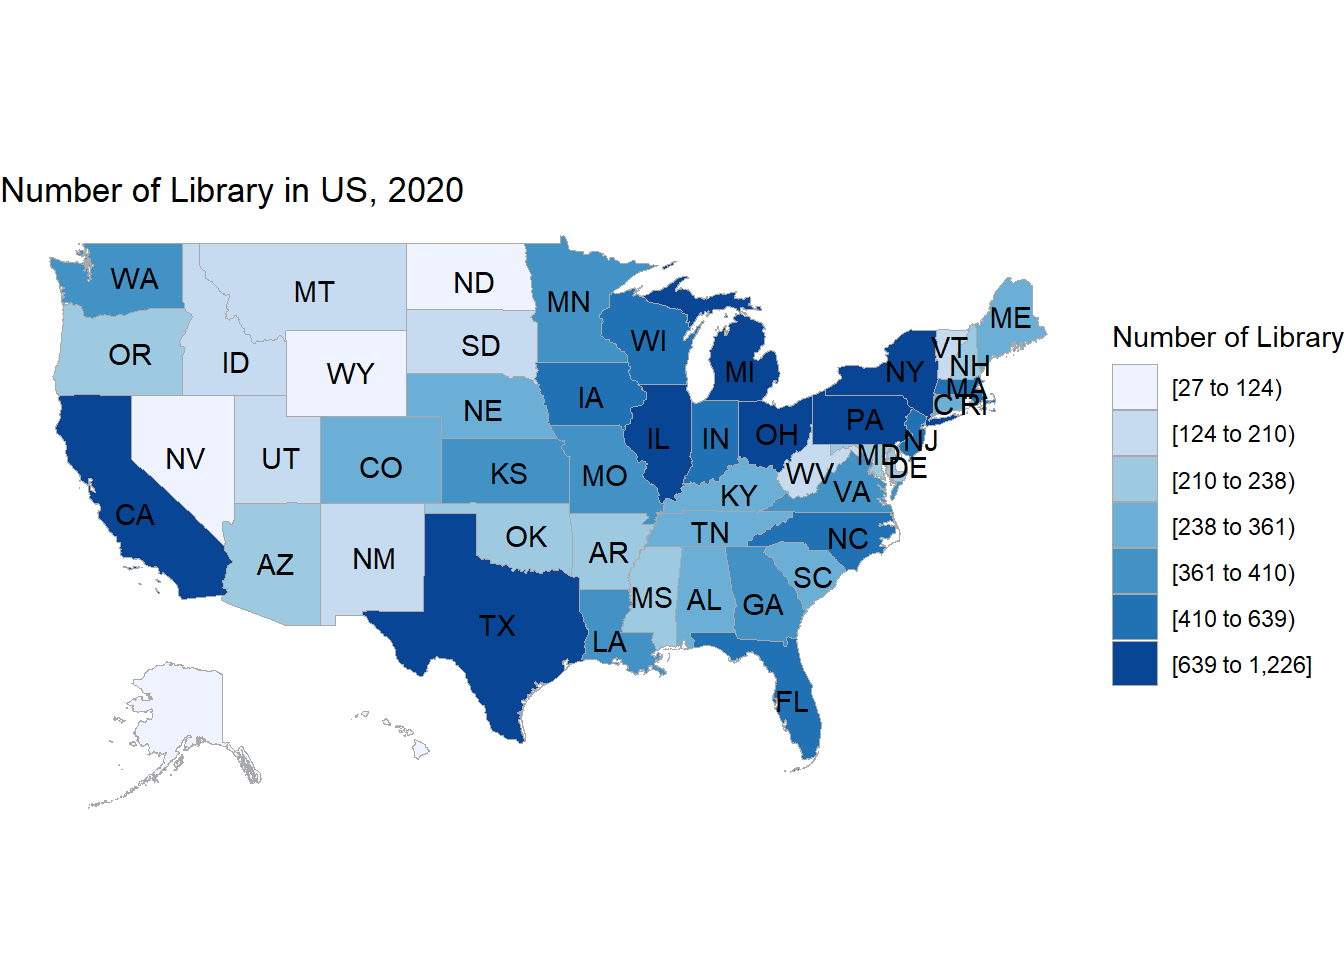
As we can see from the spatial graph, the state with higher number of library are clustered on the east side of the country especially the north east region while the state in the west east have relatively low number of libraries.
4.3.3 Relationship between museum and library distributions
Based on the two graphs above, we can clearly tell there is strong correlation between the number of museums and of libraries, which indicates that both museums and libraries play similar roles in people’s daily life and can reflect some cultural development status of that area.
We found north east and south west regions having more museums and libraries, which except indicating there might have more population, also reflecting that people in there regions seem to enjoy cultural life more.
In addition, there exist some difference between museum and library distributions, states owing many libraries may have less museums, like Utah, on the contrary, states owing many museums may have less libraries, like North Dakota. We think it may be related to some specially local preferences.